

A good conversion rate for Google Ads is 8.18 percent if you want the headline number, and that figure is less useful than it looks. It is the median across roughly 13,500 US search campaigns measured between April 2025 and March 2026, and by industry the same dataset runs from 2.64 percent to 16.22 percent.
So the honest answer to "is my conversion rate good" is that a benchmark cannot tell you. Not because benchmarks are worthless, but because a conversion is whatever each advertiser decided to count, and nobody normalizes for that before publishing an average.
This page gives you the numbers anyway, sourced and dated, then shows you the calculation that actually answers the question you were asking.
The benchmark numbers, with their source attached
From WordStream's benchmark report, 10th edition, covering April 2025 to March 2026:
| Industry | Conversion rate |
|---|---|
| Animals and Pets | 16.22% |
| Automotive repair, service and parts | 15.51% |
| Education and Instruction | 13.14% |
| Physicians and Surgeons | 12.43% |
| Personal Services | 12.34% |
| Dentists and Dental Services | 10.67% |
| Beauty and Personal Care | 10.35% |
| All industries, median | 8.18% |
| Real Estate | 3.70% |
| Career and Employment | 3.05% |
| Furniture | 2.99% |
| Finance and Insurance | 2.64% |
Two other figures from the same study, because they travel together and people quote them separately: average click-through rate 6.64 percent, average cost per click $5.42. Attorneys pay the most per click at $9.87. Arts and entertainment pay the least at $1.63. We have taken the click-through side apart separately in what counts as a good CTR.
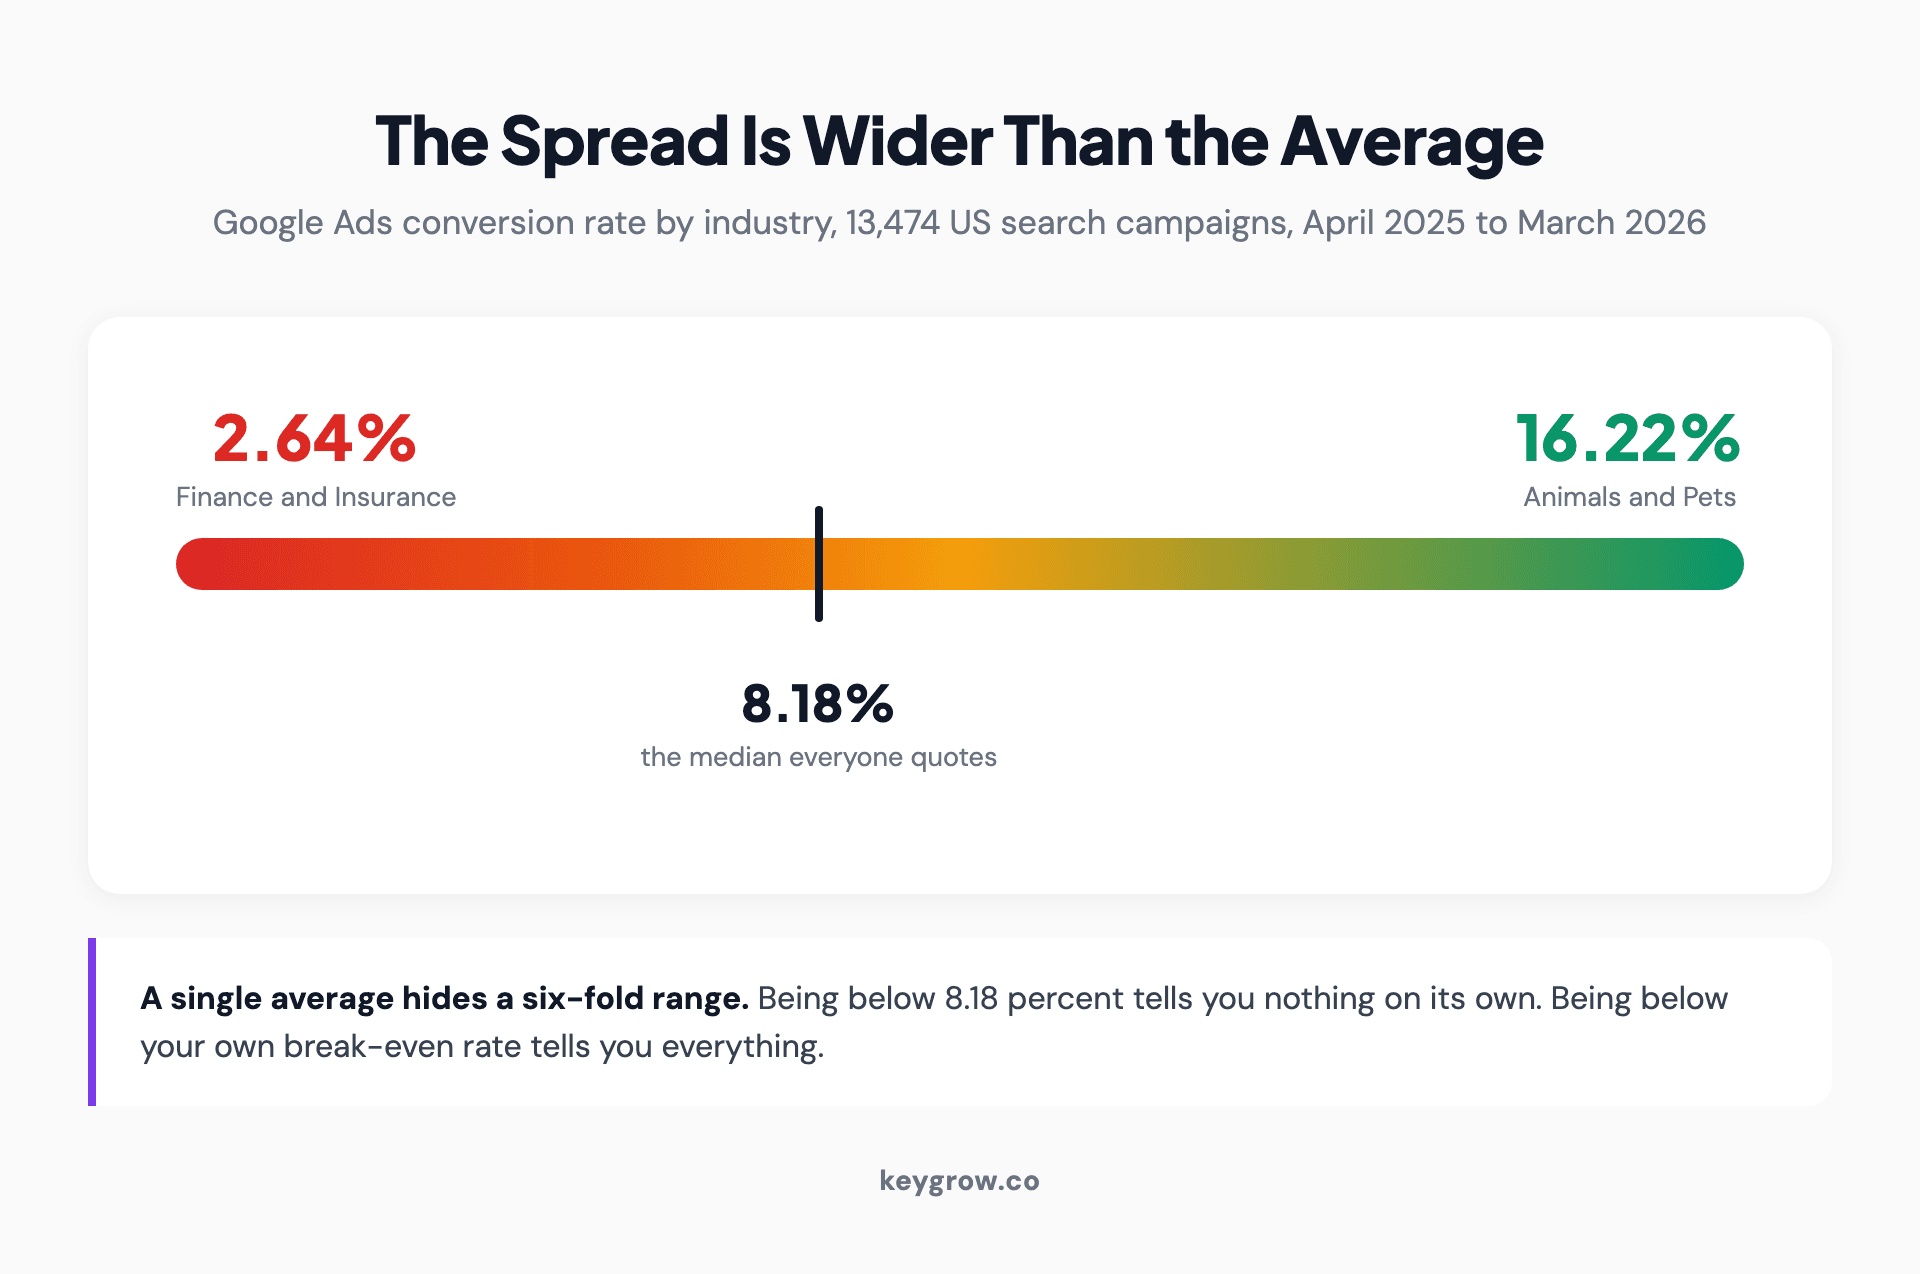
A range bar showing Google Ads conversion rates by industry running from 2.64 percent in finance and insurance to 16.22 percent in animals and pets, with the 8.18 percent overall median marked near the middle.
Why every source gives you a different number
Search this question and you will find 3.75 percent, 4.40 percent, 7.04 percent and 8.18 percent, all presented as "the average Google Ads conversion rate". They are not contradicting each other. They are measuring different things.
Four differences that matter more than any of the gaps between them:
Medians and means are not the same. WordStream's published averages are medians. A median ignores the account that converts at 60 percent because it counts newsletter signups. A mean does not. Swap one for the other and the same data moves several points.
Whose accounts were in the sample. These figures come from one agency's own client base. Agency-managed accounts are not a random sample of Google Ads. They skew toward advertisers who spend enough to hire someone.
Which platforms got combined. That dataset mixes Google Ads and Microsoft Ads campaigns. Different auctions, different audiences, one number.
Google publishes no official benchmark at all. Every figure you will ever see on this question comes from a third party with a sample and a method, which is fine as long as you know whose.
Quote a benchmark without the source, the measure and the period attached and you are repeating a rumor with a decimal point on it. Worth noting that one benchmark roundup states the sample size outright, at 13,474 campaigns, which is more than most publishers of this figure bother to do.
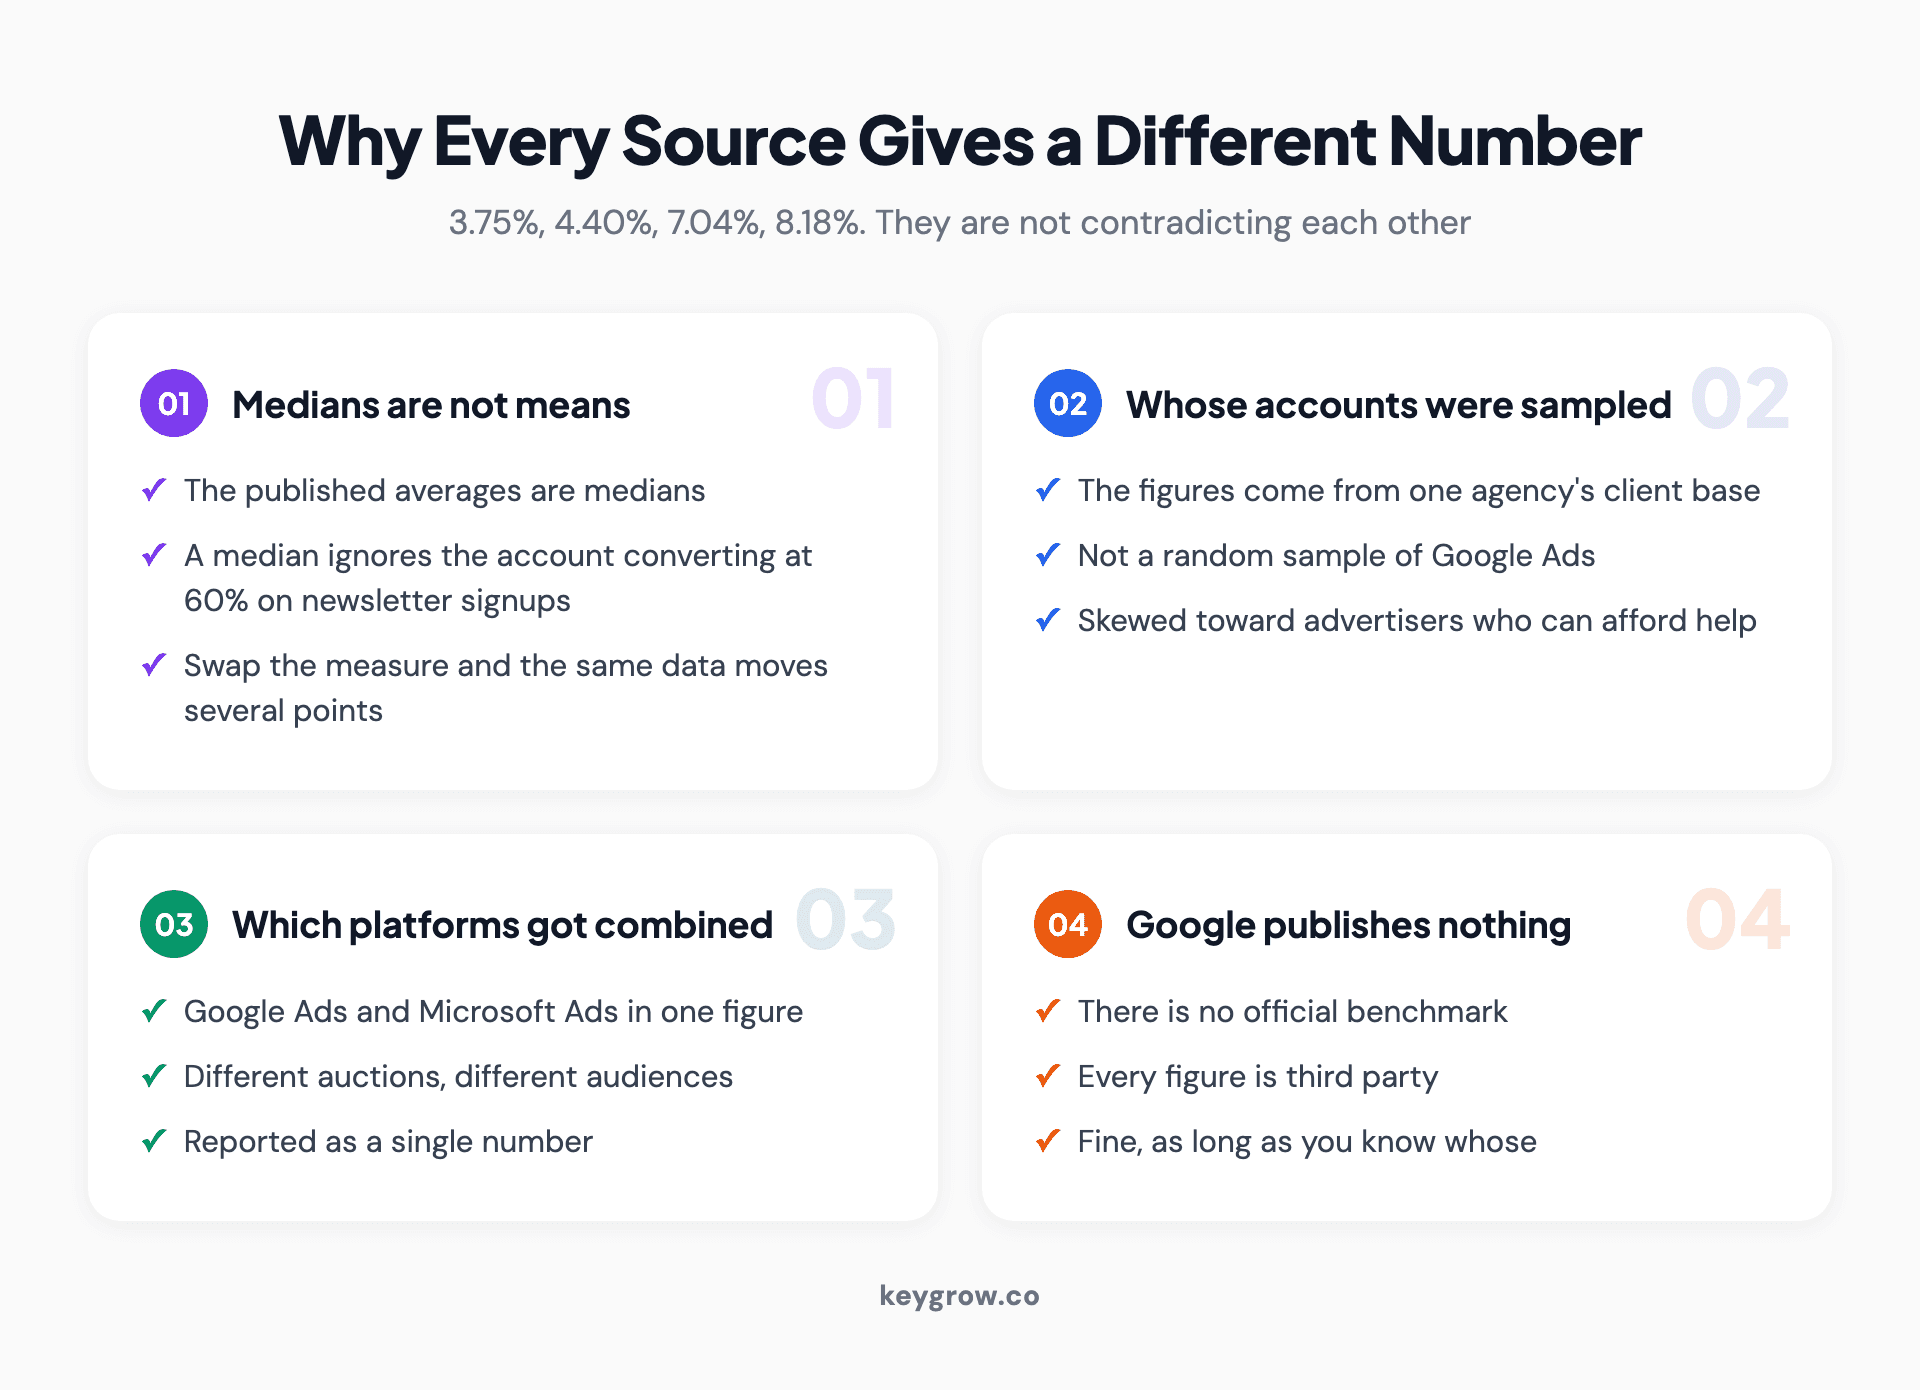
Four reasons published Google Ads conversion rate benchmarks disagree: medians are not means, the sample comes from one agency client base, Google and Microsoft campaigns are combined, and Google publishes no official benchmark.
The bigger problem: a conversion is whatever you decided it is
This is the part that makes cross-account comparison close to meaningless, and almost nobody says it out loud.
In one account, a conversion is a completed purchase. In the next, it is a form submission. In the next, it is a phone call over 30 seconds. In the next, it is somebody landing on the contact page. All four report a number in the same column of the same interface, and only one of them is a customer.
Some real ways two accounts in the same industry end up incomparable:
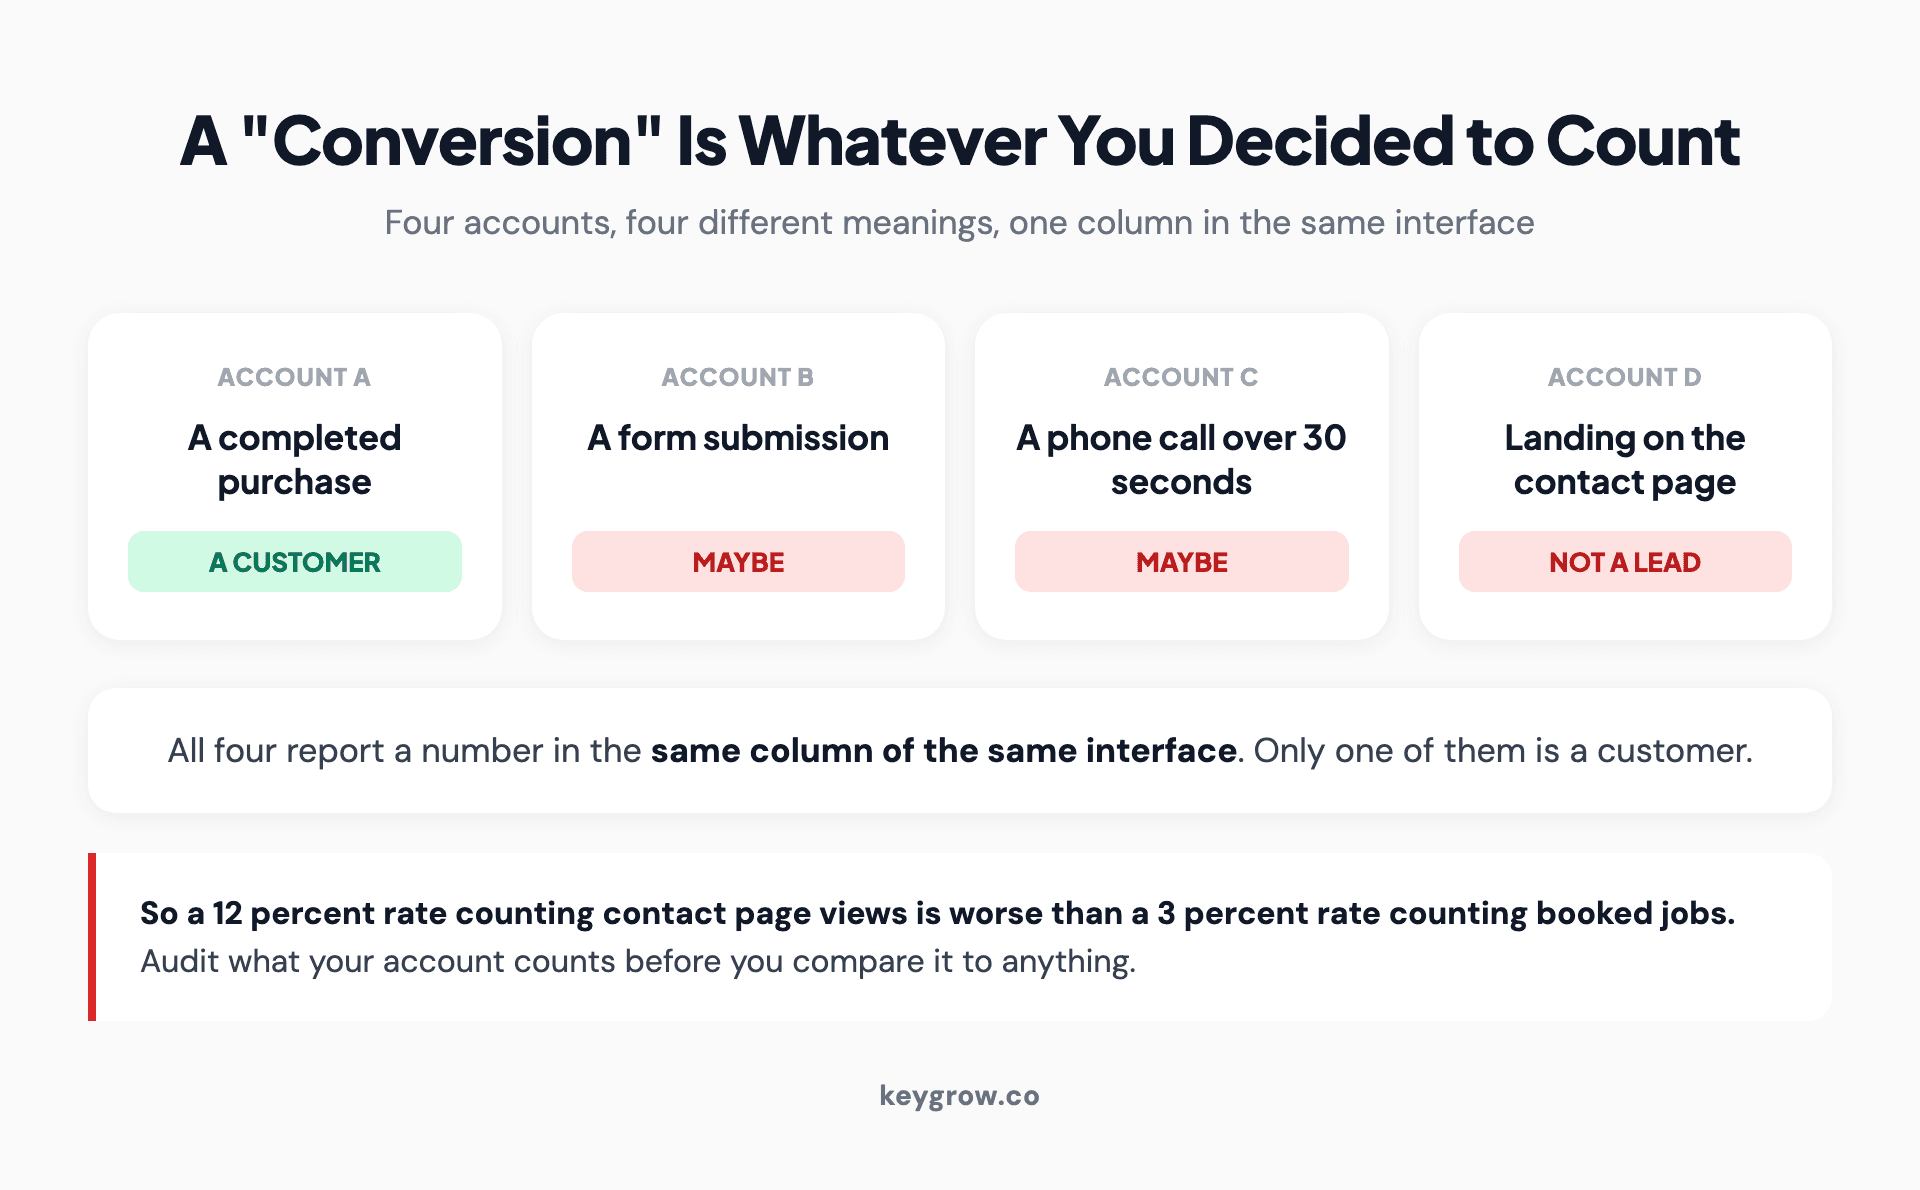
Four accounts each counting a different thing as a conversion: a completed purchase, a form submission, a phone call over 30 seconds, and a visit to the contact page, all reported in the same column of the same interface.
A 12 percent conversion rate counting contact page views is worse than a 3 percent rate counting booked jobs. If you have not audited what your account is counting, your own number is not comparable to your own number from last year, let alone to an industry median. That audit is the first half of conversion tracking setup, and it is worth doing before you benchmark anything.

A business owner working through paperwork at a table.
The number that replaces the benchmark
Here is the calculation worth more than any industry table: the conversion rate you need in order to break even.
You need three inputs, all of which you have.
1. Your cost per click. From the account, not from a benchmark.
2. Your close rate from lead to paying customer. Ask sales, or count last month.
3. What a customer is worth, gross profit rather than revenue.
Then the break-even conversion rate is your cost per click, divided by the product of your close rate and your profit per customer.
Worked through with real-ish numbers: a home services business paying $6 a click, closing one in four leads, making $600 gross profit per job. Break-even conversion rate is 6 divided by (0.25 times 600), which is 4 percent. Anything above 4 percent makes money. Anything below it loses money, no matter what the industry median says.
Now the industry table becomes genuinely useful, but only as context. A home services advertiser at 5 percent is profitable and below the 8.18 percent median. The median is not their target. Four percent is their floor, and everything above it is margin. Our break-even ROAS calculator does the same arithmetic if you would rather not do it by hand, and the Google Ads budget calculator works the other direction from a target volume.
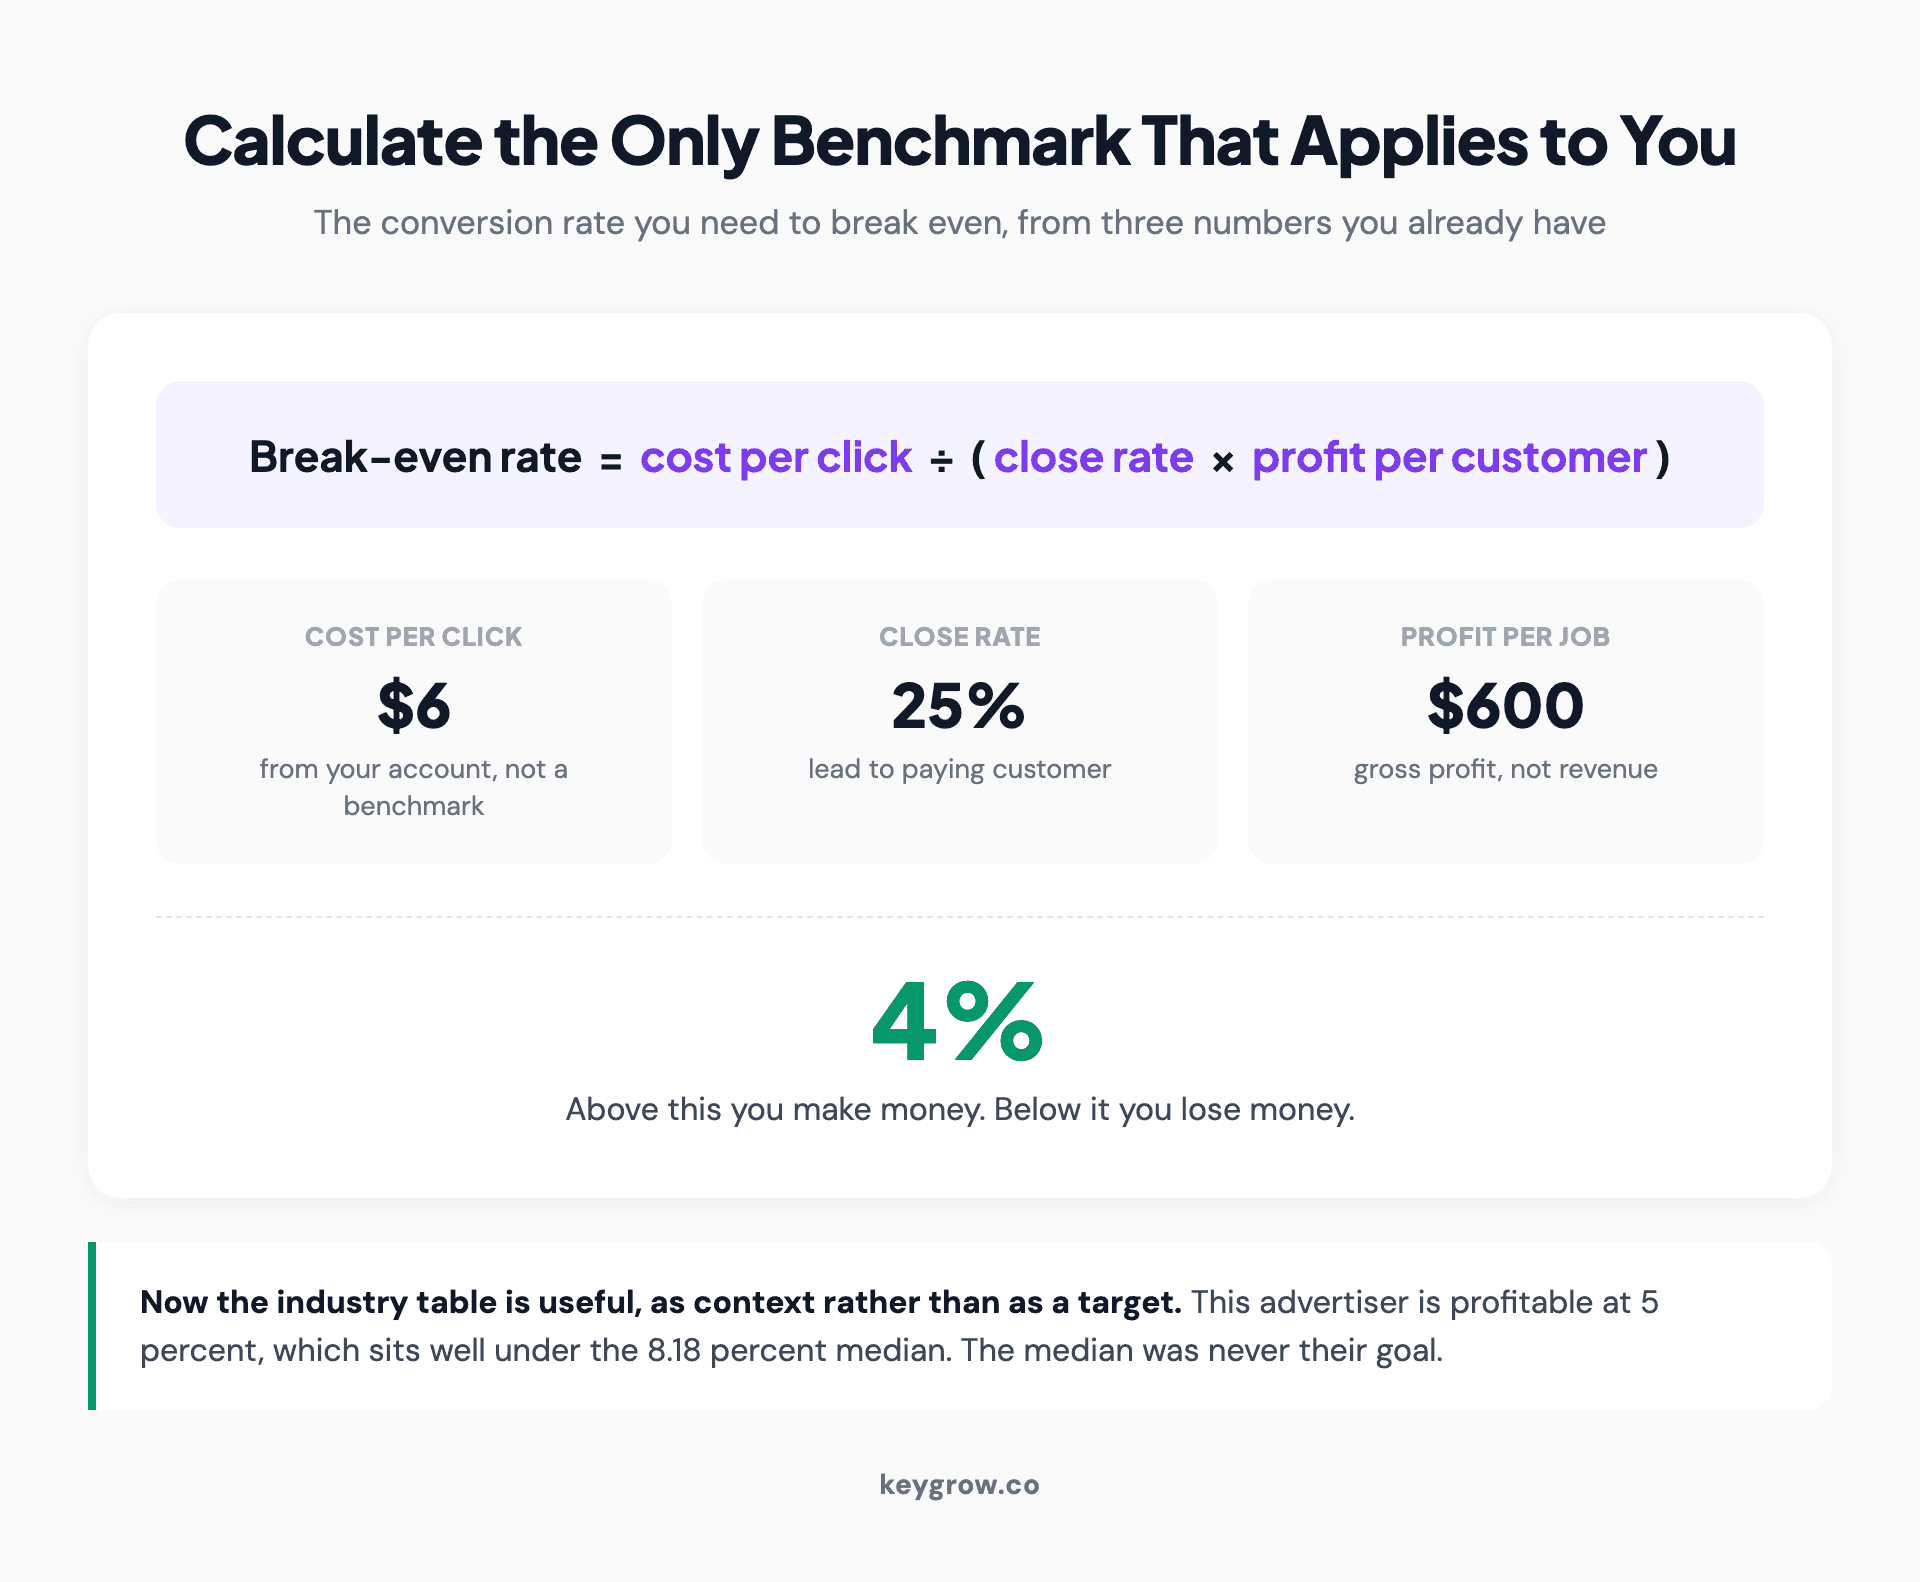
The break-even conversion rate formula worked through: a $6 cost per click divided by a 25 percent close rate multiplied by $600 profit per job gives a 4 percent break-even rate.
Cost per conversion is the number that pays rent
Conversion rate is a ratio, and ratios hide the thing you actually care about.
Take a mobile detailing account we picked up. Every click was going to the homepage, and each booking was costing about $100. Two changes: restructure the campaigns, then build a booking page for the traffic to land on. By December the cost per conversion read $22. Bookings were up 650 percent. Monthly revenue had moved from $1.2K to $5.1K.
The conversion rate moved, obviously. But the number that changed the business was $100 to $22, because that one is denominated in dollars. A report that opens with conversion rate and never reaches cost per booked job is telling you about the funnel rather than about the business. Ask why.
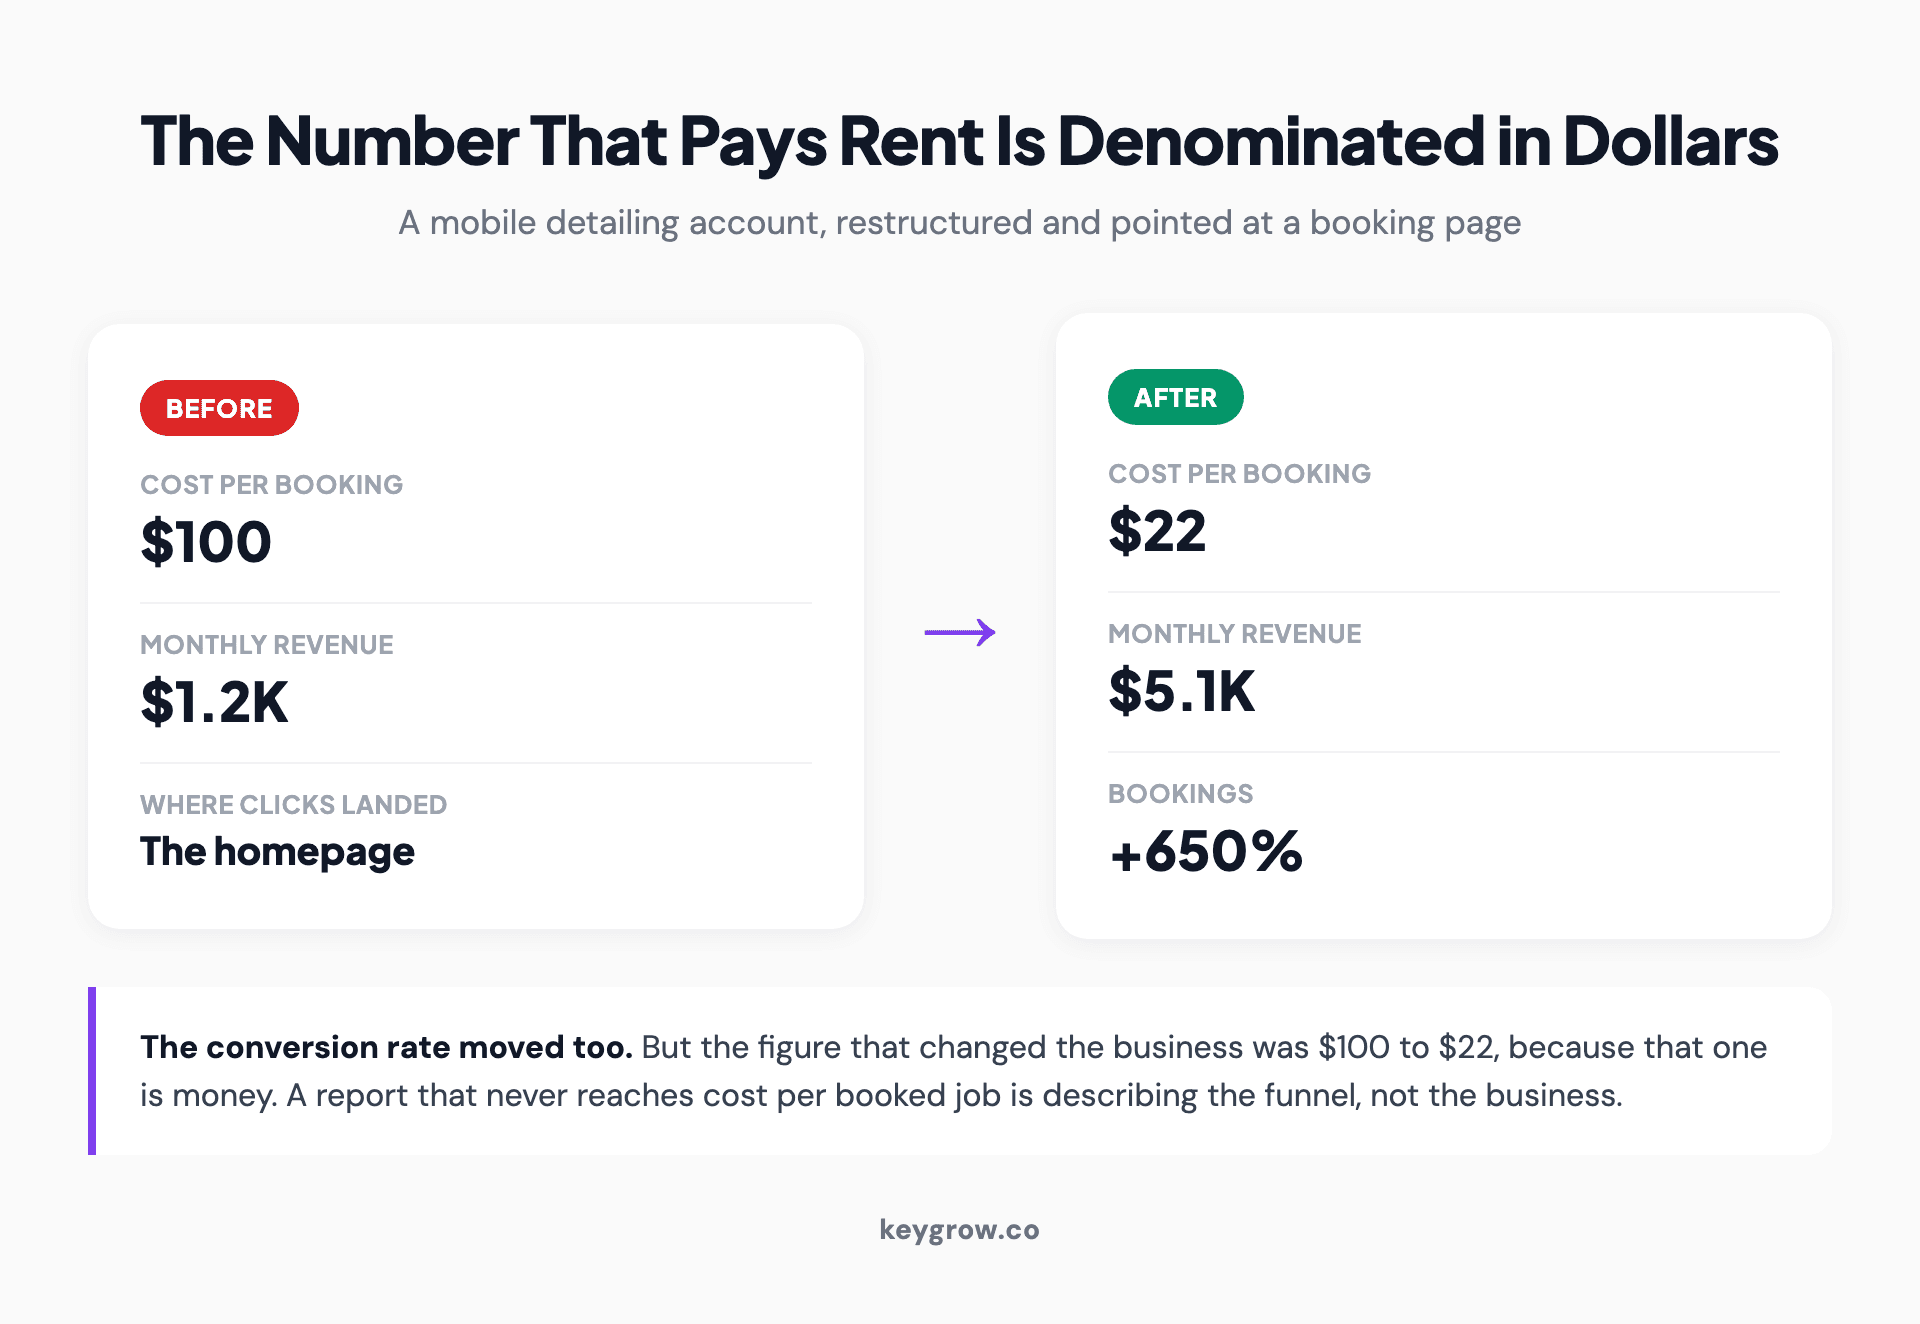
Before and after on a mobile detailing account: cost per booking $100 down to $22, monthly revenue $1.2K up to $5.1K, and bookings up 650 percent after clicks stopped landing on the homepage.
What actually moves conversion rate, in order
Most of the gap between a 3 percent account and an 8 percent account is not in the ads.
Where the click lands. The single most expensive default in paid search is sending ad traffic to a homepage. A homepage answers twelve questions. A landing page answers the one the searcher typed. This is usually the biggest single move available.
Match types and negatives. Broad match without a maintained negative list quietly buys traffic that was never going to convert. In unmanaged accounts it commonly runs 20 to 30 percent of spend. Review search terms weekly.
Intent alignment. "Emergency plumber" and "how to fix a leaking tap" are different people. If both hit the same page, one of them converts and the other inflates your denominator.
Form length and friction. Every optional field costs you submissions. Phone number, job type, postcode. Ask for the rest after they are a lead.
Speed and mobile layout. Most local search is on a phone, often on cell data. A page that takes six seconds has already lost a share of the people you paid for.
Ad copy that qualifies. Publishing a price range, a service area or a minimum job size will cut your click volume and lift your rate, because the unqualified stop clicking before you pay for them.
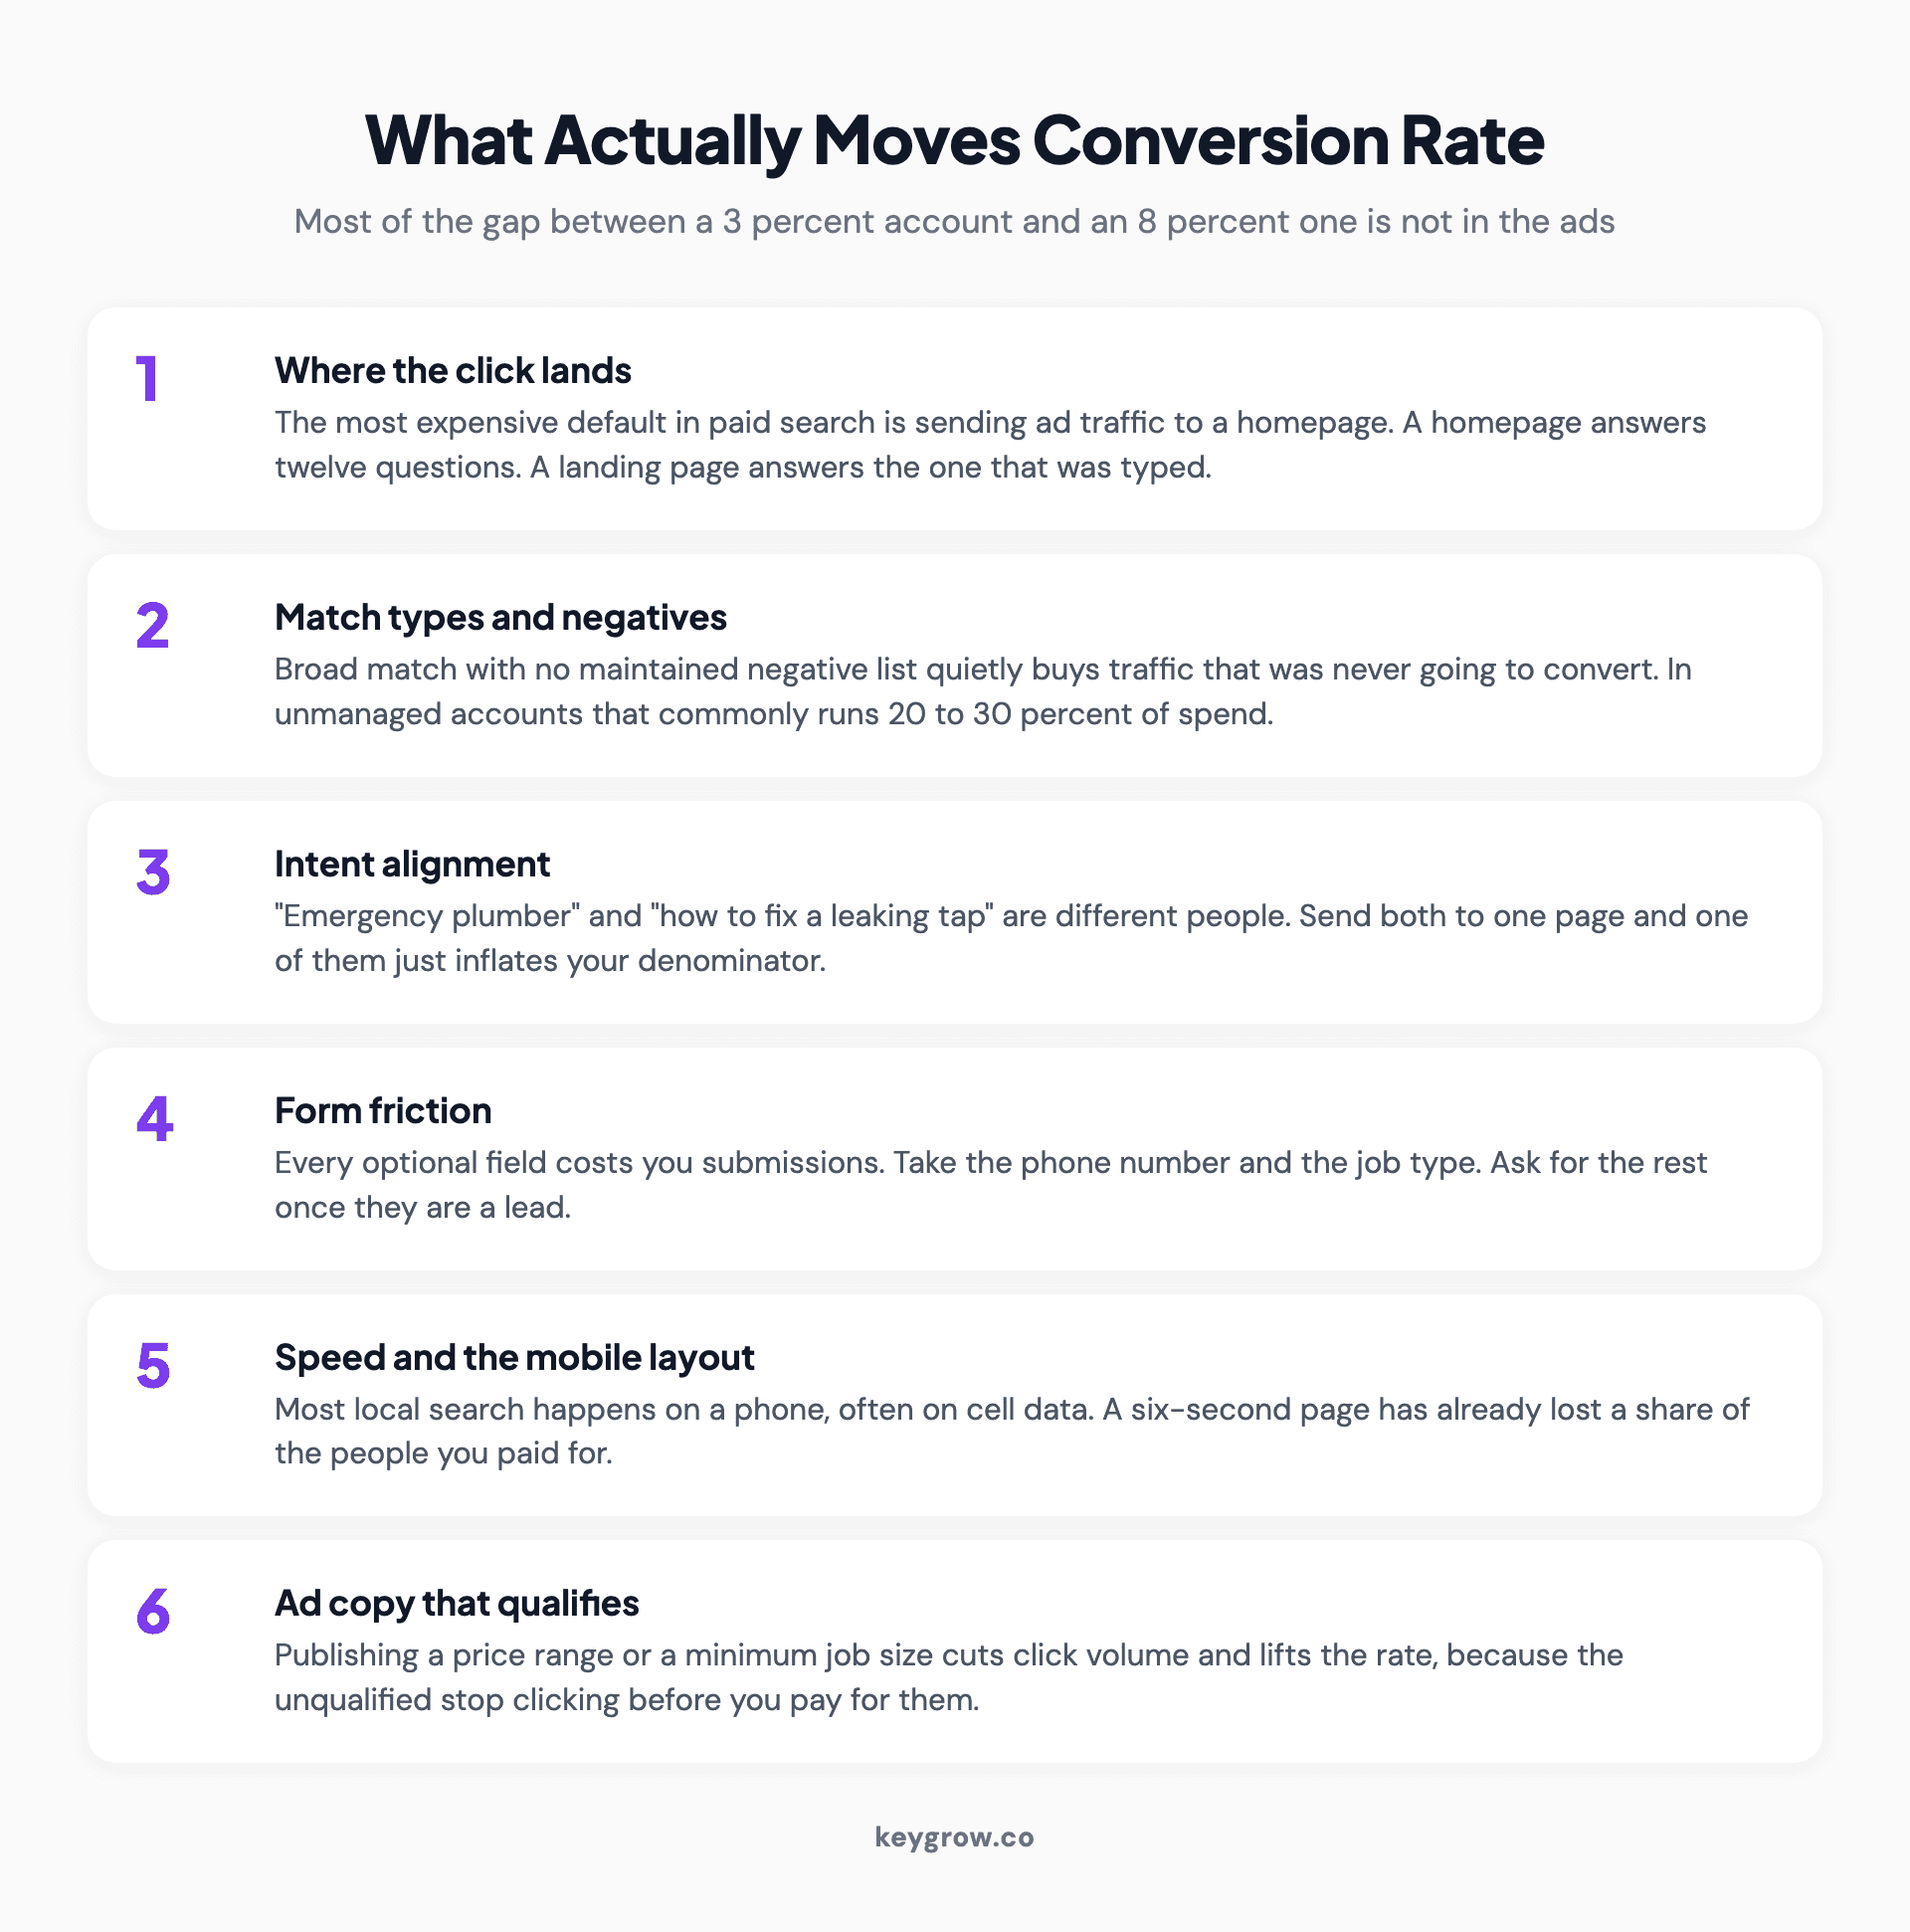
Six things that move Google Ads conversion rate, ranked: where the click lands, match types and negatives, intent alignment, form friction, page speed on mobile, and ad copy that qualifies.
When your conversion rate is fine and something else is wrong
Worth checking before you spend a month optimizing the wrong thing.
If your conversion rate is at or above your break-even figure and the business is still not growing, the constraint is somewhere else. Usually it is volume: the campaign is capped by budget or by a small keyword set, and the fix is expansion rather than optimization. Sometimes it is lead quality, where the conversions are real but they do not close, which is a targeting and qualification problem rather than a landing page one. Occasionally it is capacity, and the leads are arriving faster than anyone answers the phone.
Those need different work, and none of them get better by raising a conversion rate that is already doing its job.
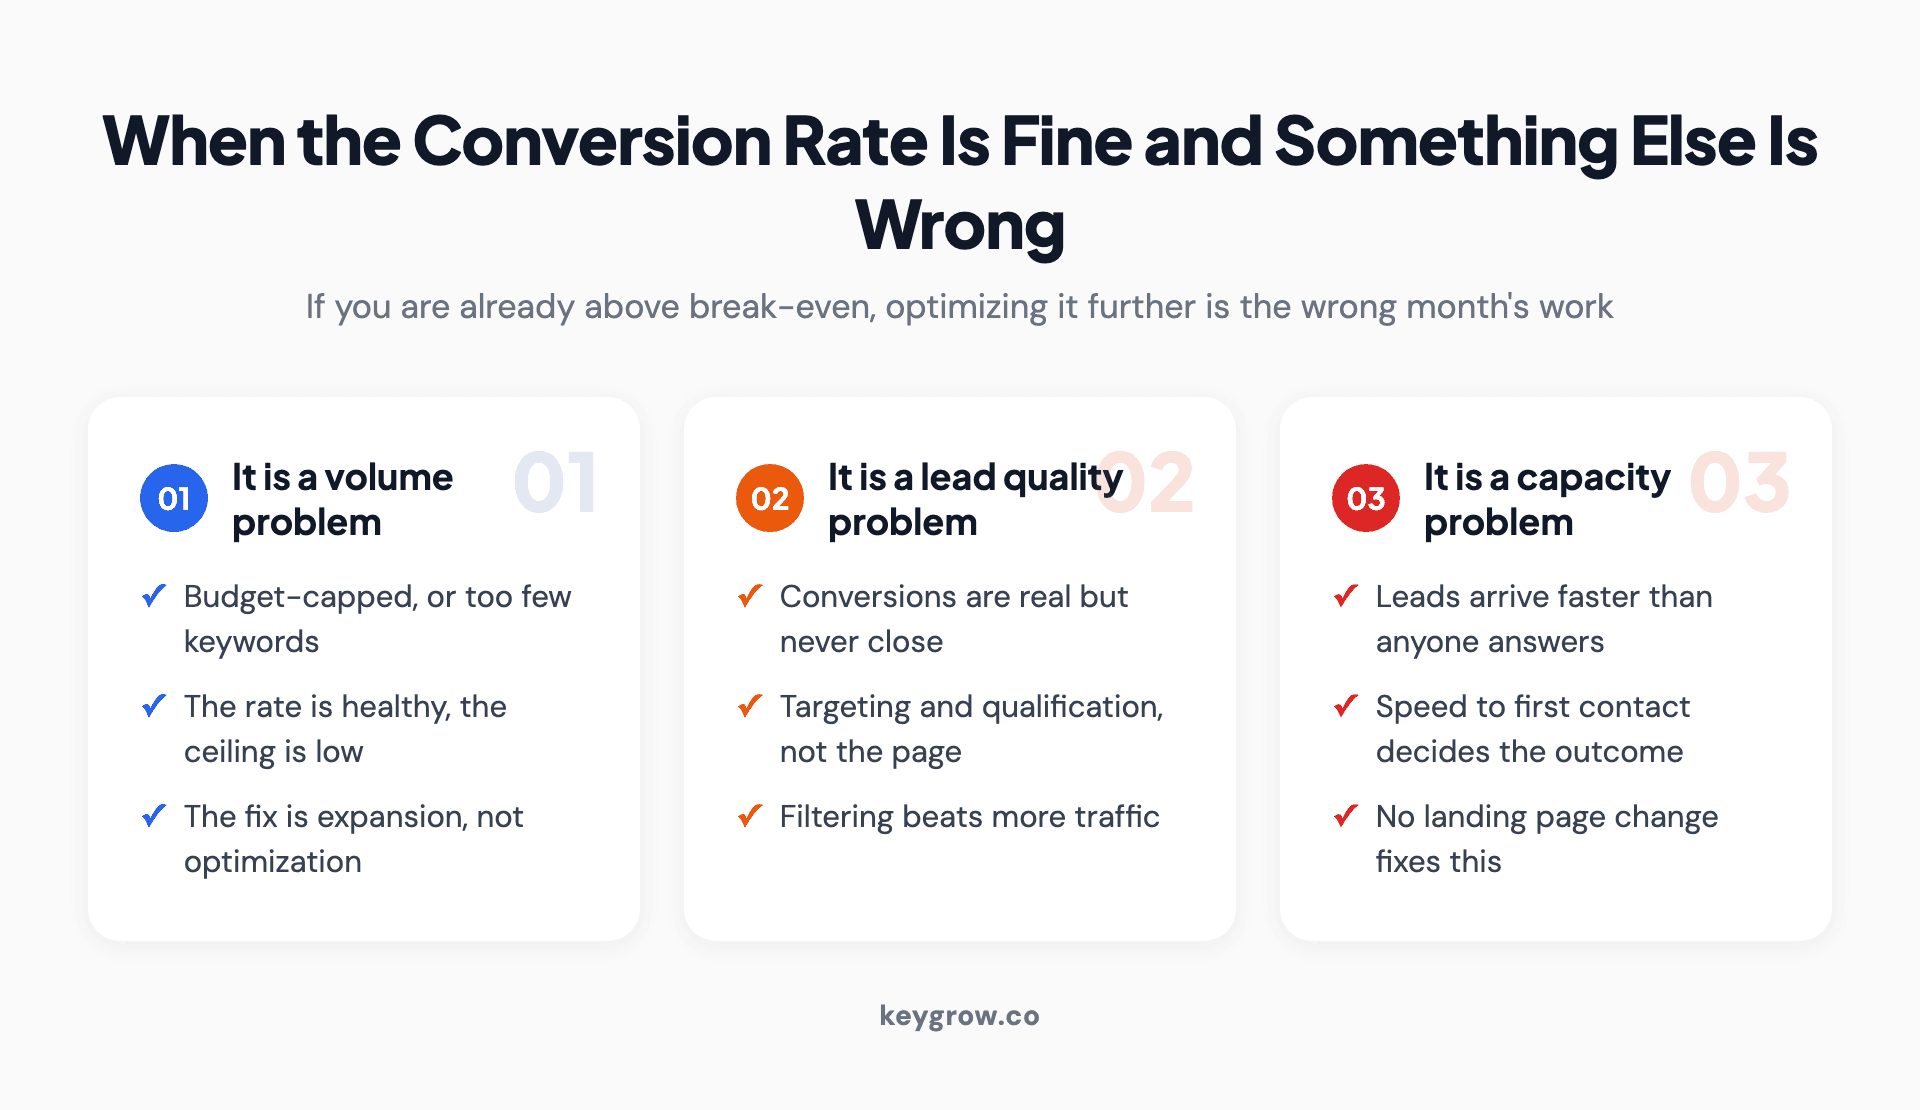
Three situations where conversion rate is not the problem: a volume problem capped by budget, a lead quality problem where conversions never close, and a capacity problem where nobody answers fast enough.
Do you need an agency for this?
Not for the diagnosis. Everything in the break-even section above is arithmetic you can do in ten minutes with numbers you already have, and the audit of what your account is counting is a free afternoon in the conversions interface. If you find that you are counting page views as conversions, you have just done the highest-value work on this page without paying anyone.
The case for help is when the arithmetic says you should be profitable and you are not, when the account is large enough that a 20 percent waste rate is real money, or when nobody internally has the hours to review search terms every week. That is where our PPC management earns its fee, on month-to-month terms, and the first thing we do is the same audit described above.

A pen resting on a stack of printed reports.
FAQs
What is a good conversion rate for Google Ads?
The median across US search campaigns is 8.18 percent, with industry medians ranging from 2.64 percent in finance and insurance to 16.22 percent in animals and pets. A more useful target is your own break-even rate: cost per click divided by your close rate multiplied by profit per customer.
Why do different sources give different average conversion rates?
Because they measure different things. Some publish medians and some publish means, samples come from different agency client bases, some combine Google Ads and Microsoft Ads, and the reporting periods differ. Google itself publishes no official benchmark.
Is a 2 percent Google Ads conversion rate bad?
Not necessarily. In finance and insurance the industry median is 2.64 percent, so 2 percent is close to normal. What matters is whether 2 percent clears your break-even rate given your cost per click and what a customer is worth.
What conversion rate should a lead generation campaign aim for?
Lead generation rates usually run higher than ecommerce because the action is cheaper for the user. Service industries in the benchmark data sit between roughly 10 and 15 percent. Compare against your own break-even figure rather than against ecommerce numbers.
How do I calculate my break-even conversion rate?
Divide your cost per click by the product of your lead-to-customer close rate and your gross profit per customer. At $6 per click, a 25 percent close rate and $600 profit per job, the break-even rate is 4 percent.
Does conversion rate matter more than cost per conversion?
Cost per conversion matters more, because it is denominated in money. Conversion rate is a ratio that can move for reasons that have nothing to do with profitability, including counting a cheaper conversion action.
Why did my conversion rate drop suddenly?
Check what changed in tracking before you change anything in the campaign. A new tag, a changed form, a counting setting, or a new conversion action added as primary will all move the rate without anything happening in the market. Real market shifts are usually gradual.
What conversion rate should a new campaign expect?
Lower than benchmark for the first few weeks, while the bidding gathers data and the search terms get cleaned up. Judge a new campaign on cost per conversion trend rather than on a rate compared to an industry table.
What to do with your own number
Open the conversions view in your account and write down what is actually being counted as primary. If anything on that list is not a real business outcome, that is today's job and nothing else on this page matters until it is done.
Then do the break-even arithmetic once. Cost per click, close rate, profit per customer. That single figure tells you more than the entire table at the top of this page, because it is the only one calculated from your business rather than from someone else's client list.
Compare to the benchmark after that, if you like, and treat it as weather rather than as a target.


