


A good ROAS is one that clears your break-even ROAS with room left for fees and profit. For a store on a 40 percent margin, that usually lands between 3.3:1 and 3.8:1 (333% to 383%). The honest caveat: no benchmark can hand you your number, because the same 4:1 return makes one business money and quietly sinks another.
ROAS (return on ad spend) is the revenue your ads bring in divided by what the ads cost. $4,000 in sales from $1,000 of spend is a 4:1 ROAS, which Google Ads shows as 400%. What is a good ROAS for you comes down to your margin, and the math takes about five minutes.
Below is that math, a margin table you can read your floor from, the 2026 benchmarks with their dates, and the part most guides skip: why a plumbing company can't read ROAS the way an online store does.
ROAS is revenue per ad dollar, not profit
ROAS counts revenue, so it tells you nothing about profit until you know your margin. A 300% ROAS on a 25 percent margin product loses money on every sale.
Take a $100 order that cost $30 in ads. The ad report says 333%. If the product, shipping and payment fees ate $75 of that $100, you kept $25 and paid $30 to get it. You are down $5 a sale, and the dashboard is green.
That is why the question has no single answer. Revenue looks the same in every account. Margin doesn't.
ROI gets mixed up with ROAS all the time. ROI is profit divided by total cost, including product, staff and tools, while ROAS only looks at ad spend. Only one of them can tell you whether the business made money.
How do you calculate break-even ROAS?
Break-even ROAS is 1 divided by your contribution margin. At a 40 percent margin it is 1 ÷ 0.40 = 2.5, or 250%. Below that line, every sale the ads drive loses money.
Contribution margin is what is left of a sale after the costs that travel with it: the product, shipping, payment processing, packaging, and an allowance for returns. It is not your net profit margin. Net profit has already had marketing, rent and salaries taken out, so plugging it into the formula sets break-even far too high. At least one of the guides ranking for this question does exactly that.

Stacked cardboard boxes, pallets and packaging supplies in a bright warehouse.
An illustration, with made-up but realistic numbers:
- Average order value: $80
- Product cost: $32
- Shipping: $10
- Payment fees and returns allowance: $6
- Contribution: $80 − $48 = $32, a 40 percent contribution margin
Break-even ROAS is $80 ÷ $32 = 2.5. Same answer as 1 ÷ 0.40, because it is the same formula written the other way round. Our break-even ROAS calculator takes shipping, fees and returns as separate fields if you would rather not do it by hand.
Break-even ROAS by gross margin
The lower the margin, the steeper the climb. A 20 percent margin needs 5:1 just to stand still. An 80 percent margin breaks even at 1.25:1.
The last column is the ROAS you need to keep 10 percent of revenue as profit after ad spend, using 1 ÷ (margin − 0.10). It makes a sensible first target.
| Contribution margin | Break-even ROAS | Shown in Google Ads | ROAS to keep 10% profit |
|---|---|---|---|
| 20% | 5.00 | 500% | 10.00 (1,000%) |
| 25% | 4.00 | 400% | 6.67 (667%) |
| 30% | 3.33 | 333% | 5.00 (500%) |
| 40% | 2.50 | 250% | 3.33 (333%) |
| 50% | 2.00 | 200% | 2.50 (250%) |
| 60% | 1.67 | 167% | 2.00 (200%) |
| 70% | 1.43 | 143% | 1.67 (167%) |
| 80% | 1.25 | 125% | 1.43 (143%) |
Read across a row and the trouble with rules of thumb shows up fast. The "4:1 is good" line repeated across the web is exactly break-even at a 25 percent margin. For a brand on 70 percent margins, 4:1 is a very good month. For a store on 20 percent, it is a loss.
Add the costs the ad platform never sees
Your real floor sits above break-even. Management fees, creative costs and the profit you want all raise the ROAS an account needs before it counts as working.
Start with fees. If an agency or freelancer charges a percentage of spend, every ad dollar costs you more than a dollar, so multiply break-even by 1 plus the fee rate. A 15 percent fee turns the 2.5 floor from the example into 2.5 × 1.15 = 2.88.
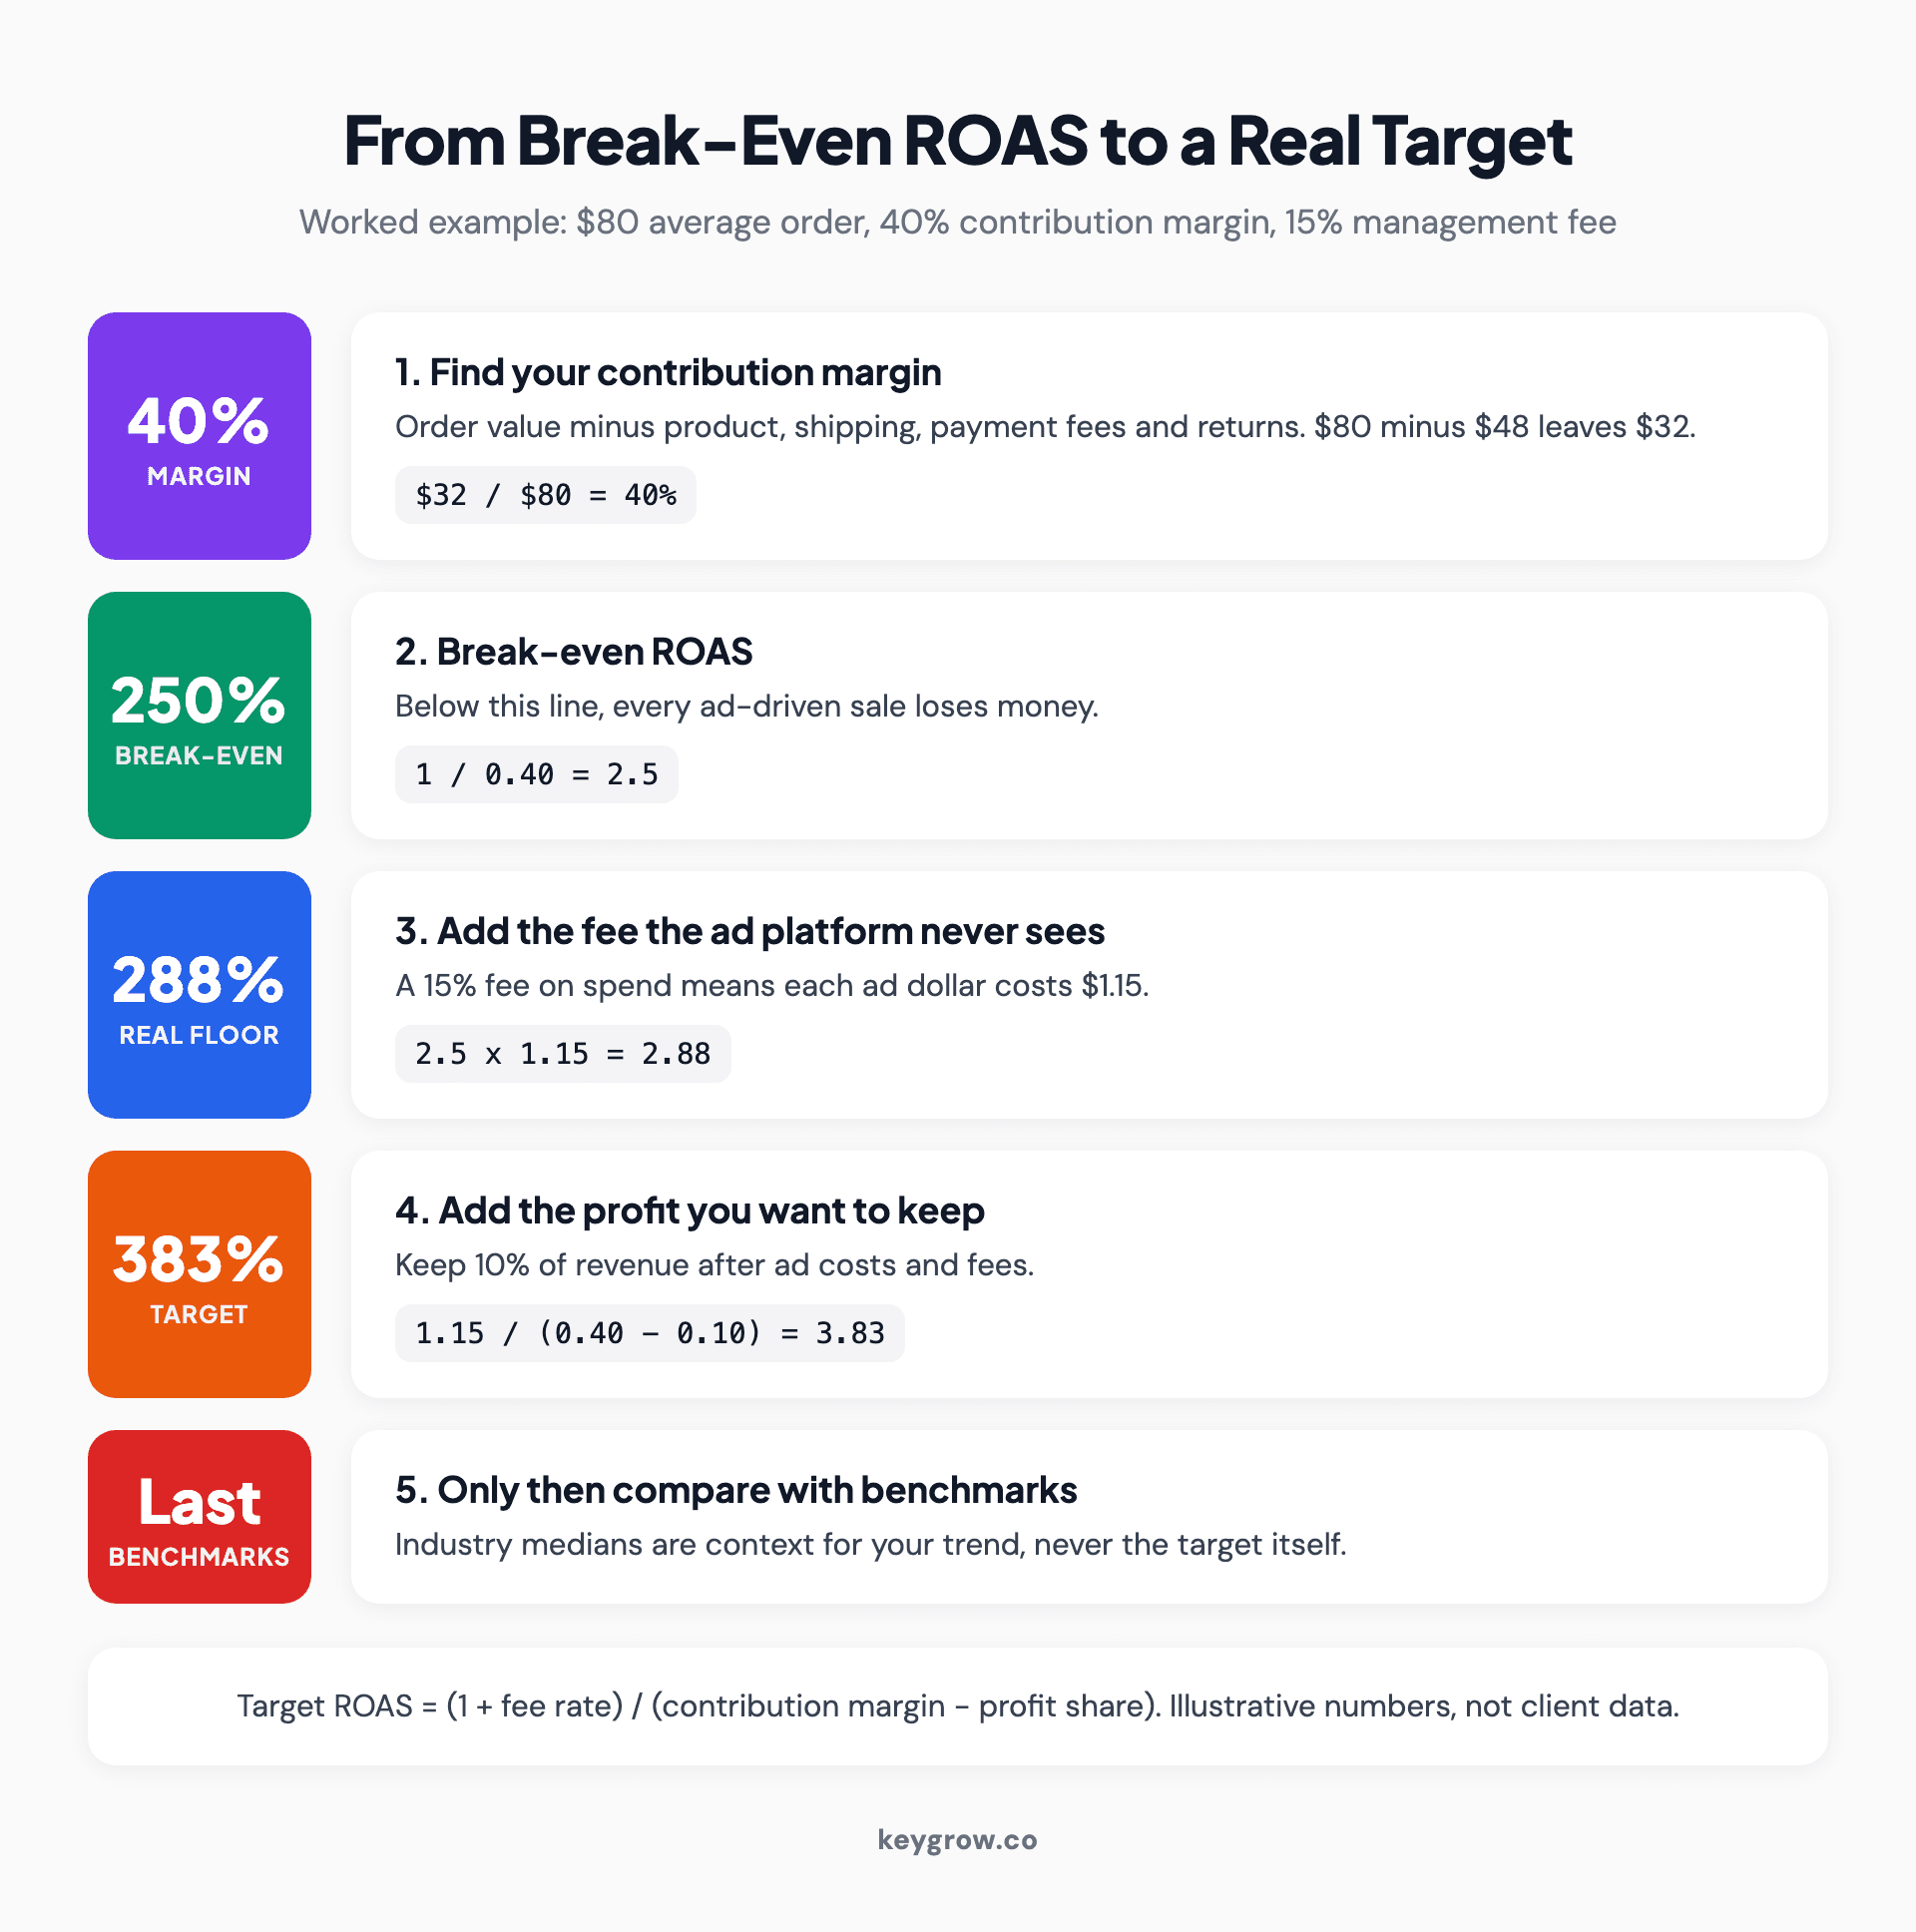
Four-step ladder for a store with an $80 average order and a 40 percent contribution margin: a 250 percent break-even ROAS, a 288 percent floor once a 15 percent management fee is added, and a 383 percent target that keeps 10 percent of revenue as profit, with a reminder to check benchmarks only after that.
Then add the profit you want. The full formula:
Target ROAS = (1 + fee rate) ÷ (contribution margin − profit share)
For the $80 store with a 15 percent fee that wants to keep 10 percent of revenue: 1.15 ÷ (0.40 − 0.10) = 3.83, or 383%. That is the number to put in the account, and nobody's benchmark produced it.
A flat monthly fee works the same way once you divide it by spend. $1,500 a month on $10,000 of spend is a 15 percent fee rate. On $3,000 of spend it is 50 percent, which is why small accounts struggle to carry a management fee at all.
If you sell products with very different margins, run this per product group rather than once for the whole catalog. A blended target lets the low-margin items hide behind the high-margin ones.
What the 2026 benchmarks say, with dates
Benchmarks show where other accounts landed, not where yours should. Use them to sanity-check your trend, and only once you know your floor.
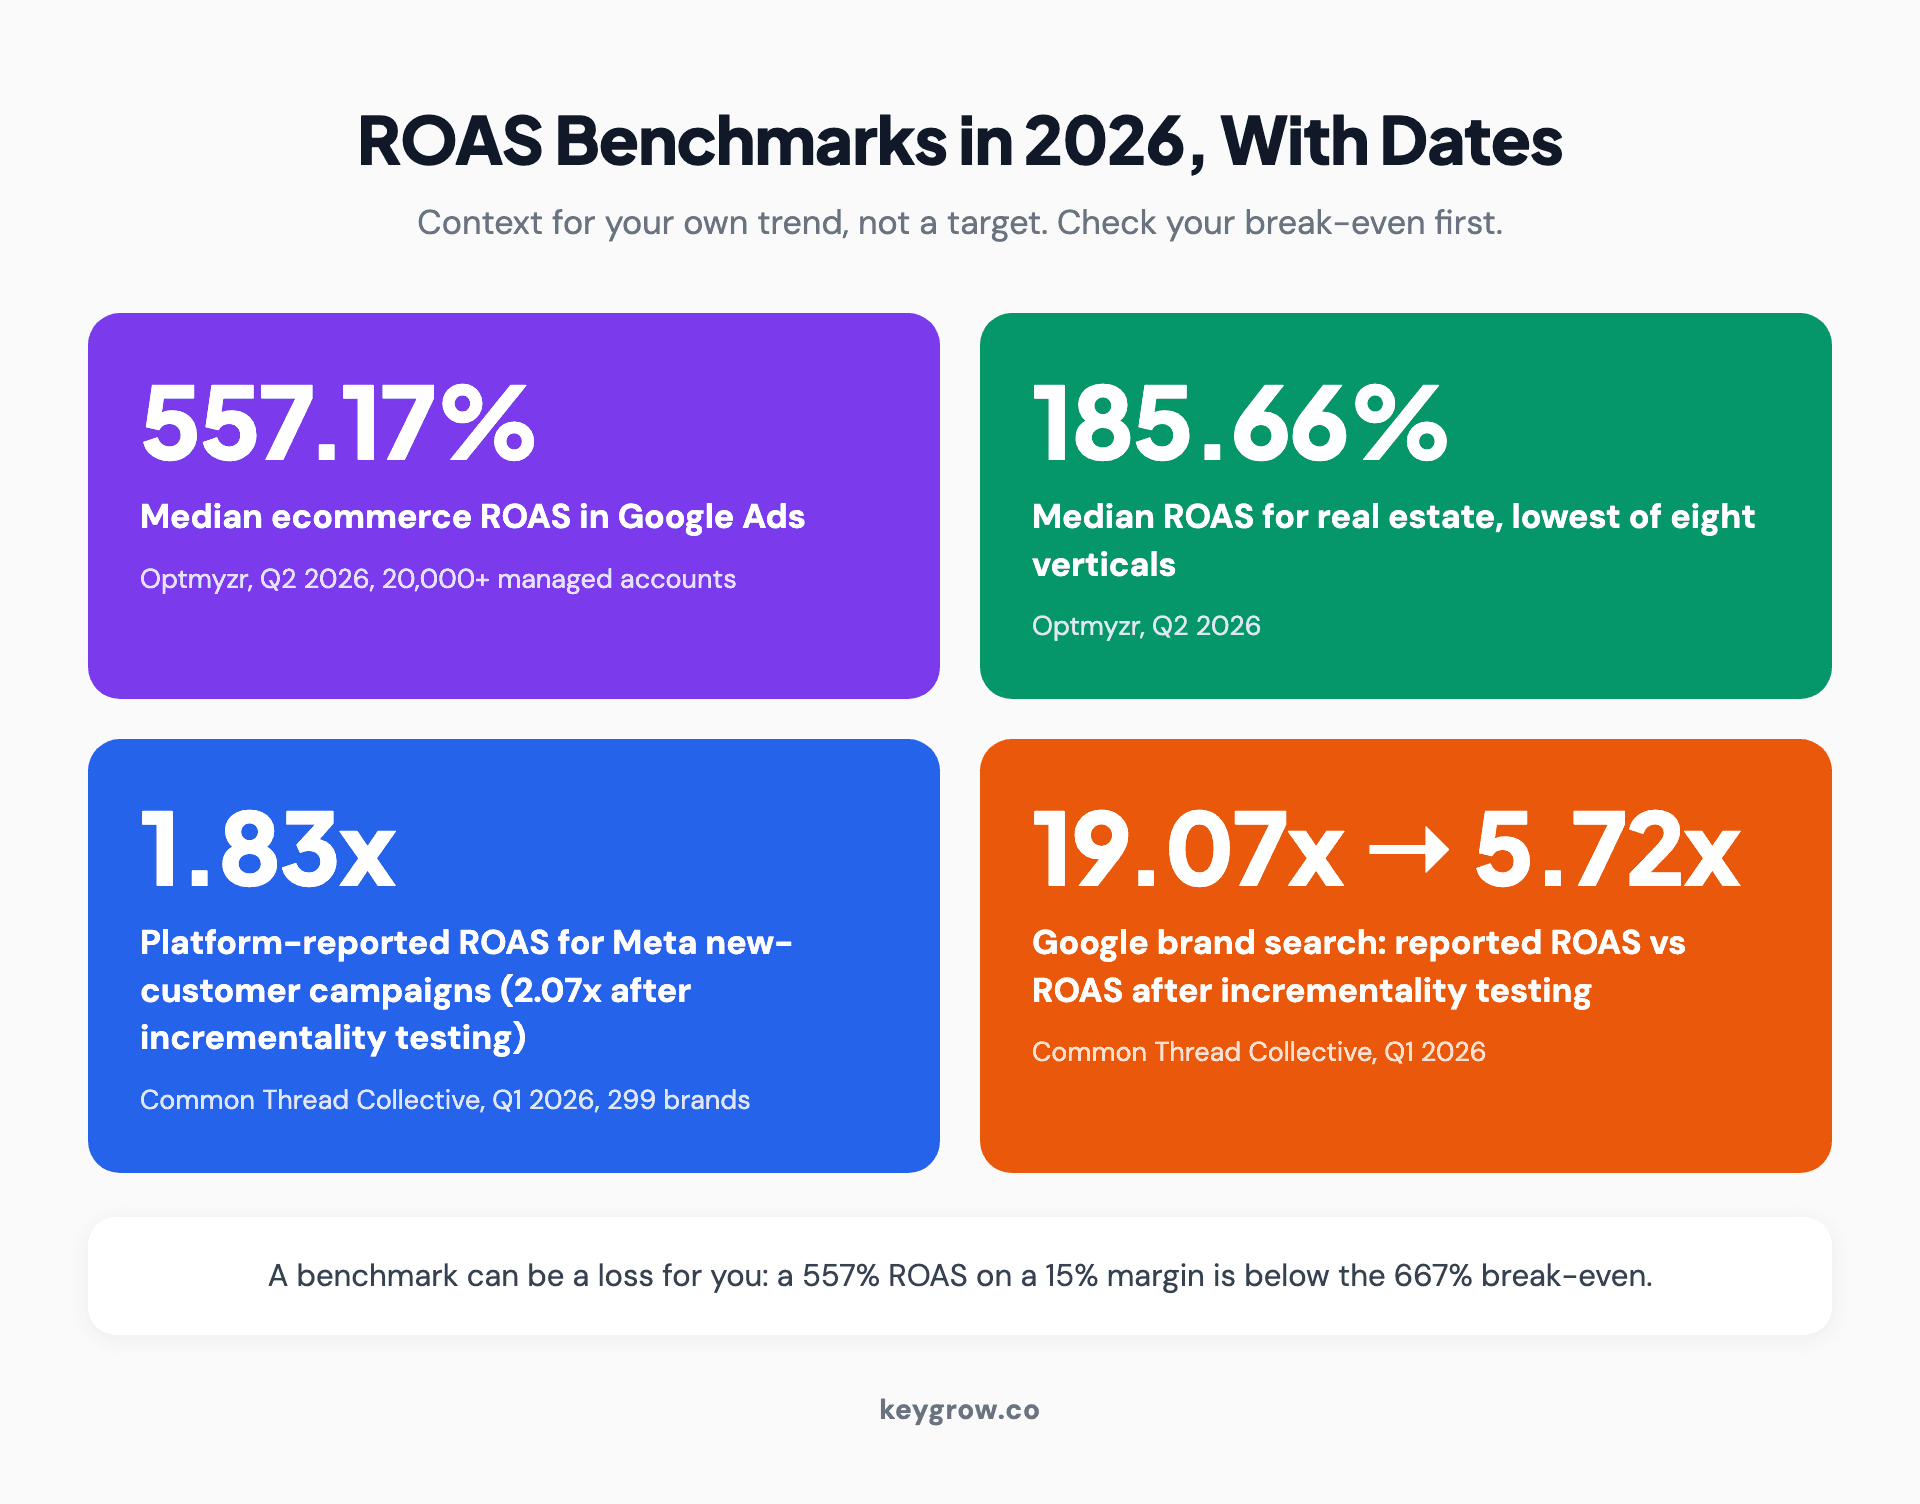
Stat strip of 2026 ROAS benchmarks: a 557.17 percent median ecommerce ROAS in Google Ads for Q2 2026, a 185.66 percent median for real estate accounts, a 1.83x platform-reported ROAS for Meta new-customer campaigns in Q1 2026, and Google brand search reporting 19.07x but measuring 5.72x after incrementality testing.
The biggest recent Google Ads dataset is Optmyzr's Q2 2026 report, drawn from more than 20,000 managed accounts. Optmyzr's ROAS benchmarks put the median ecommerce account at 557.17%, small business accounts at 511.32% and sports at 753.64%. Real estate was the lowest of eight published verticals at 185.66%. Local Services campaigns showed 5.30%, which says more about tracking than performance: many of those conversions pass no value back to Google.
The ROAS a platform reports is also not the ROAS the ads caused. one ecommerce agency's benchmark covered 299 ecommerce brands in Q1 2026 and adjusted each channel's reported ROAS using geo-holdout experiments and media mix models:
| Channel (Q1 2026) | ROAS the platform reported | ROAS after incrementality testing |
|---|---|---|
| Google brand search | 19.07x | 5.72x |
| Google non-brand search | 9.30x | 6.97x |
| Meta new-customer (acquisition) campaigns | 1.83x | 2.07x |
| Meta non-acquisition campaigns | 5.88x | 3.53x |
Brand search looks like the star of the account and mostly collects sales that would have happened anyway. Meta's new-customer campaigns look weak and are slightly undercounted.
One number worth retiring is Google's "$2 for every $1." Google's own methodology describes it as $2 of profit, not revenue, and traces it to a 2009 paper by Hal Varian, the company's first chief economist. It was never a ROAS benchmark.
Why is a good ROAS different for a service business?
A service business has no cart total, so its ROAS is only as real as the lead values you feed the ad platform. Get the values wrong and the ROAS column is fiction.
A store knows what a sale is worth the moment it happens. A plumber or a law firm gets a form fill or a phone call, and the money turns up days or weeks later, if at all. To have a ROAS, you have to put a value on the lead.

A hand tightening a pipe fitting on a water heater with a yellow-handled wrench.
The usual method is expected revenue: close rate times average job value. Our guide to working out what a lead is worth covers it properly, repeat customers included. Here is how it plays out for a hypothetical plumbing company:
- 40 percent of leads become booked jobs
- The average job is $450
- Expected revenue per lead: 0.40 × $450 = $180
- Gross margin on a job, after parts and labor: 50 percent
- Cost per lead: $45
Import $180 as the lead value and the account shows 400% against a break-even of 1 ÷ 0.50 = 200%. Import profit instead ($90 a lead) and the same account shows 200% against a break-even of 100%. Import nothing, or a placeholder value of 1, and you get the Local Services problem: a number that means nothing.
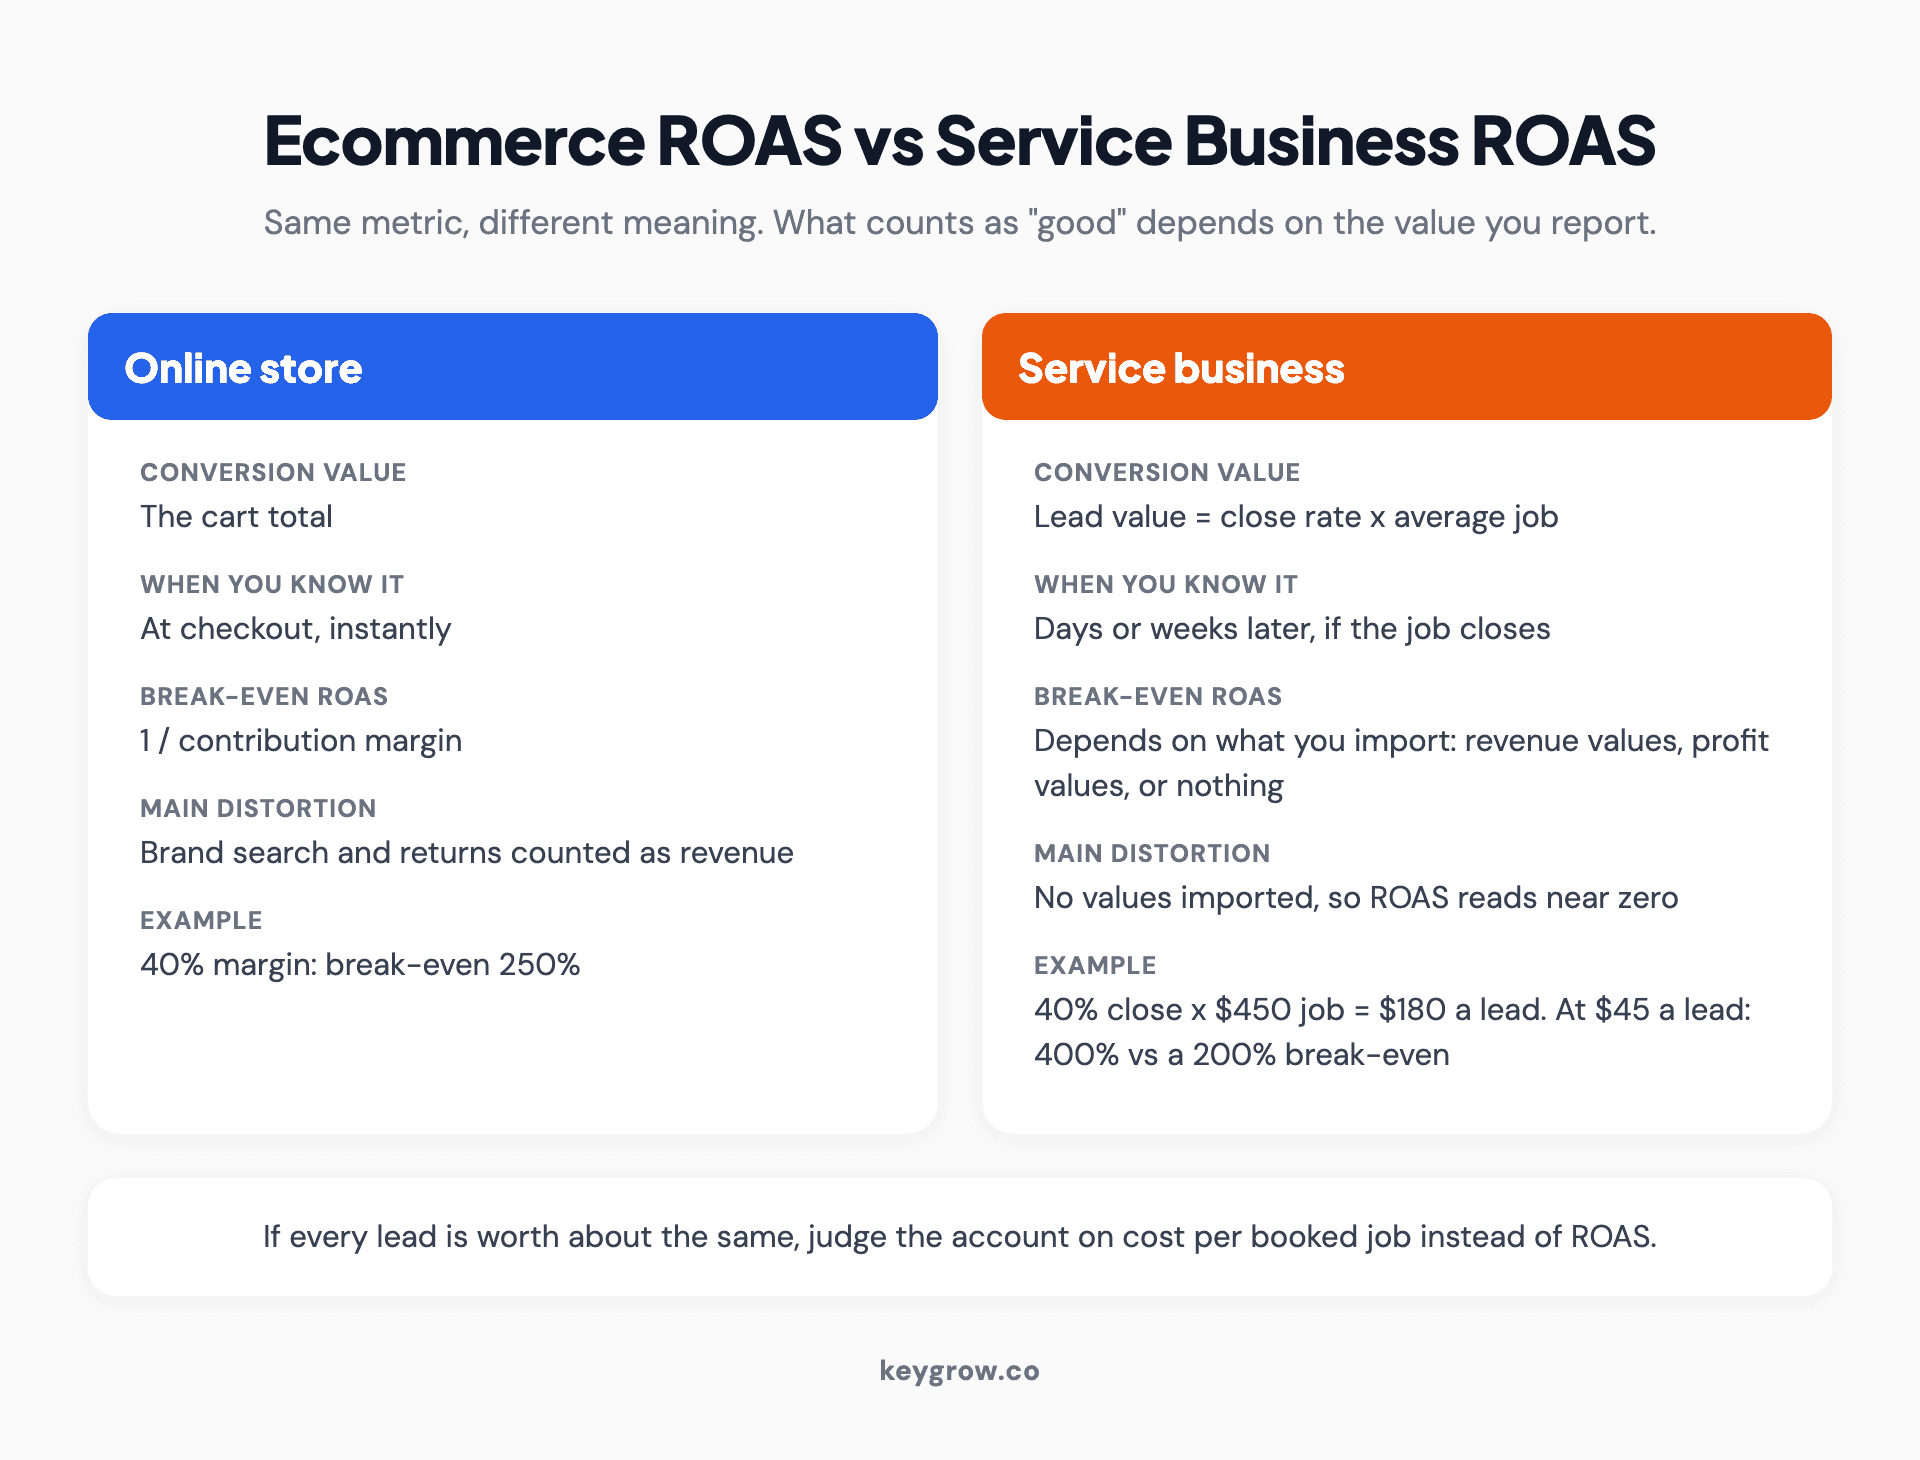
Comparison cards for ecommerce ROAS versus service business ROAS: a store's conversion value is the cart total, known at checkout, with break-even of 1 divided by margin, while a service business uses a lead value of close rate times average job, learns the real value weeks later, and gets a different break-even depending on whether it imports revenue, profit or nothing.
None of the three versions is wrong. The mistake is comparing your service ROAS to an ecommerce benchmark, or to last year's figure after someone quietly changed what the values meant. Write down which version you use and stick with it.
For plenty of service businesses, cost per booked job against what a job is worth is the plainer test. We saw it with a mobile car detailing campaign that was paying around $100 per booking while its clicks went to the homepage. After a campaign rebuild and a dedicated booking page, cost per conversion fell to $22, and monthly revenue went from $1.2K to $5.1K between August and December 2022.
If your leads don't carry values that differ, you may not want a ROAS target at all. Our guide to choosing between Target ROAS and Target CPA walks through when each one fits.
When a low ROAS is fine and a high one is a warning
A ROAS below target can be the right call when first orders turn into repeat orders. A ROAS far above every benchmark usually means a campaign is taking credit for sales it didn't cause.
Low can be fine when:
- Customers come back. Say a coffee subscription keeps the average customer for eight months: the first order can run at break-even or below, because you are paying for the customer and not the basket.
- You are buying new customers on purpose. Prospecting nearly always reports a lower ROAS than retargeting, and in the Q1 2026 data above, Meta's new-customer campaigns reported 1.83x while being worth a little more.
- You just launched. A new product has no history, so the first weeks are data collection with a price tag.
High is a warning when the campaign is brand search, retargeting, or both. In those figures, brand search reported 19.07x and measured 5.72x.
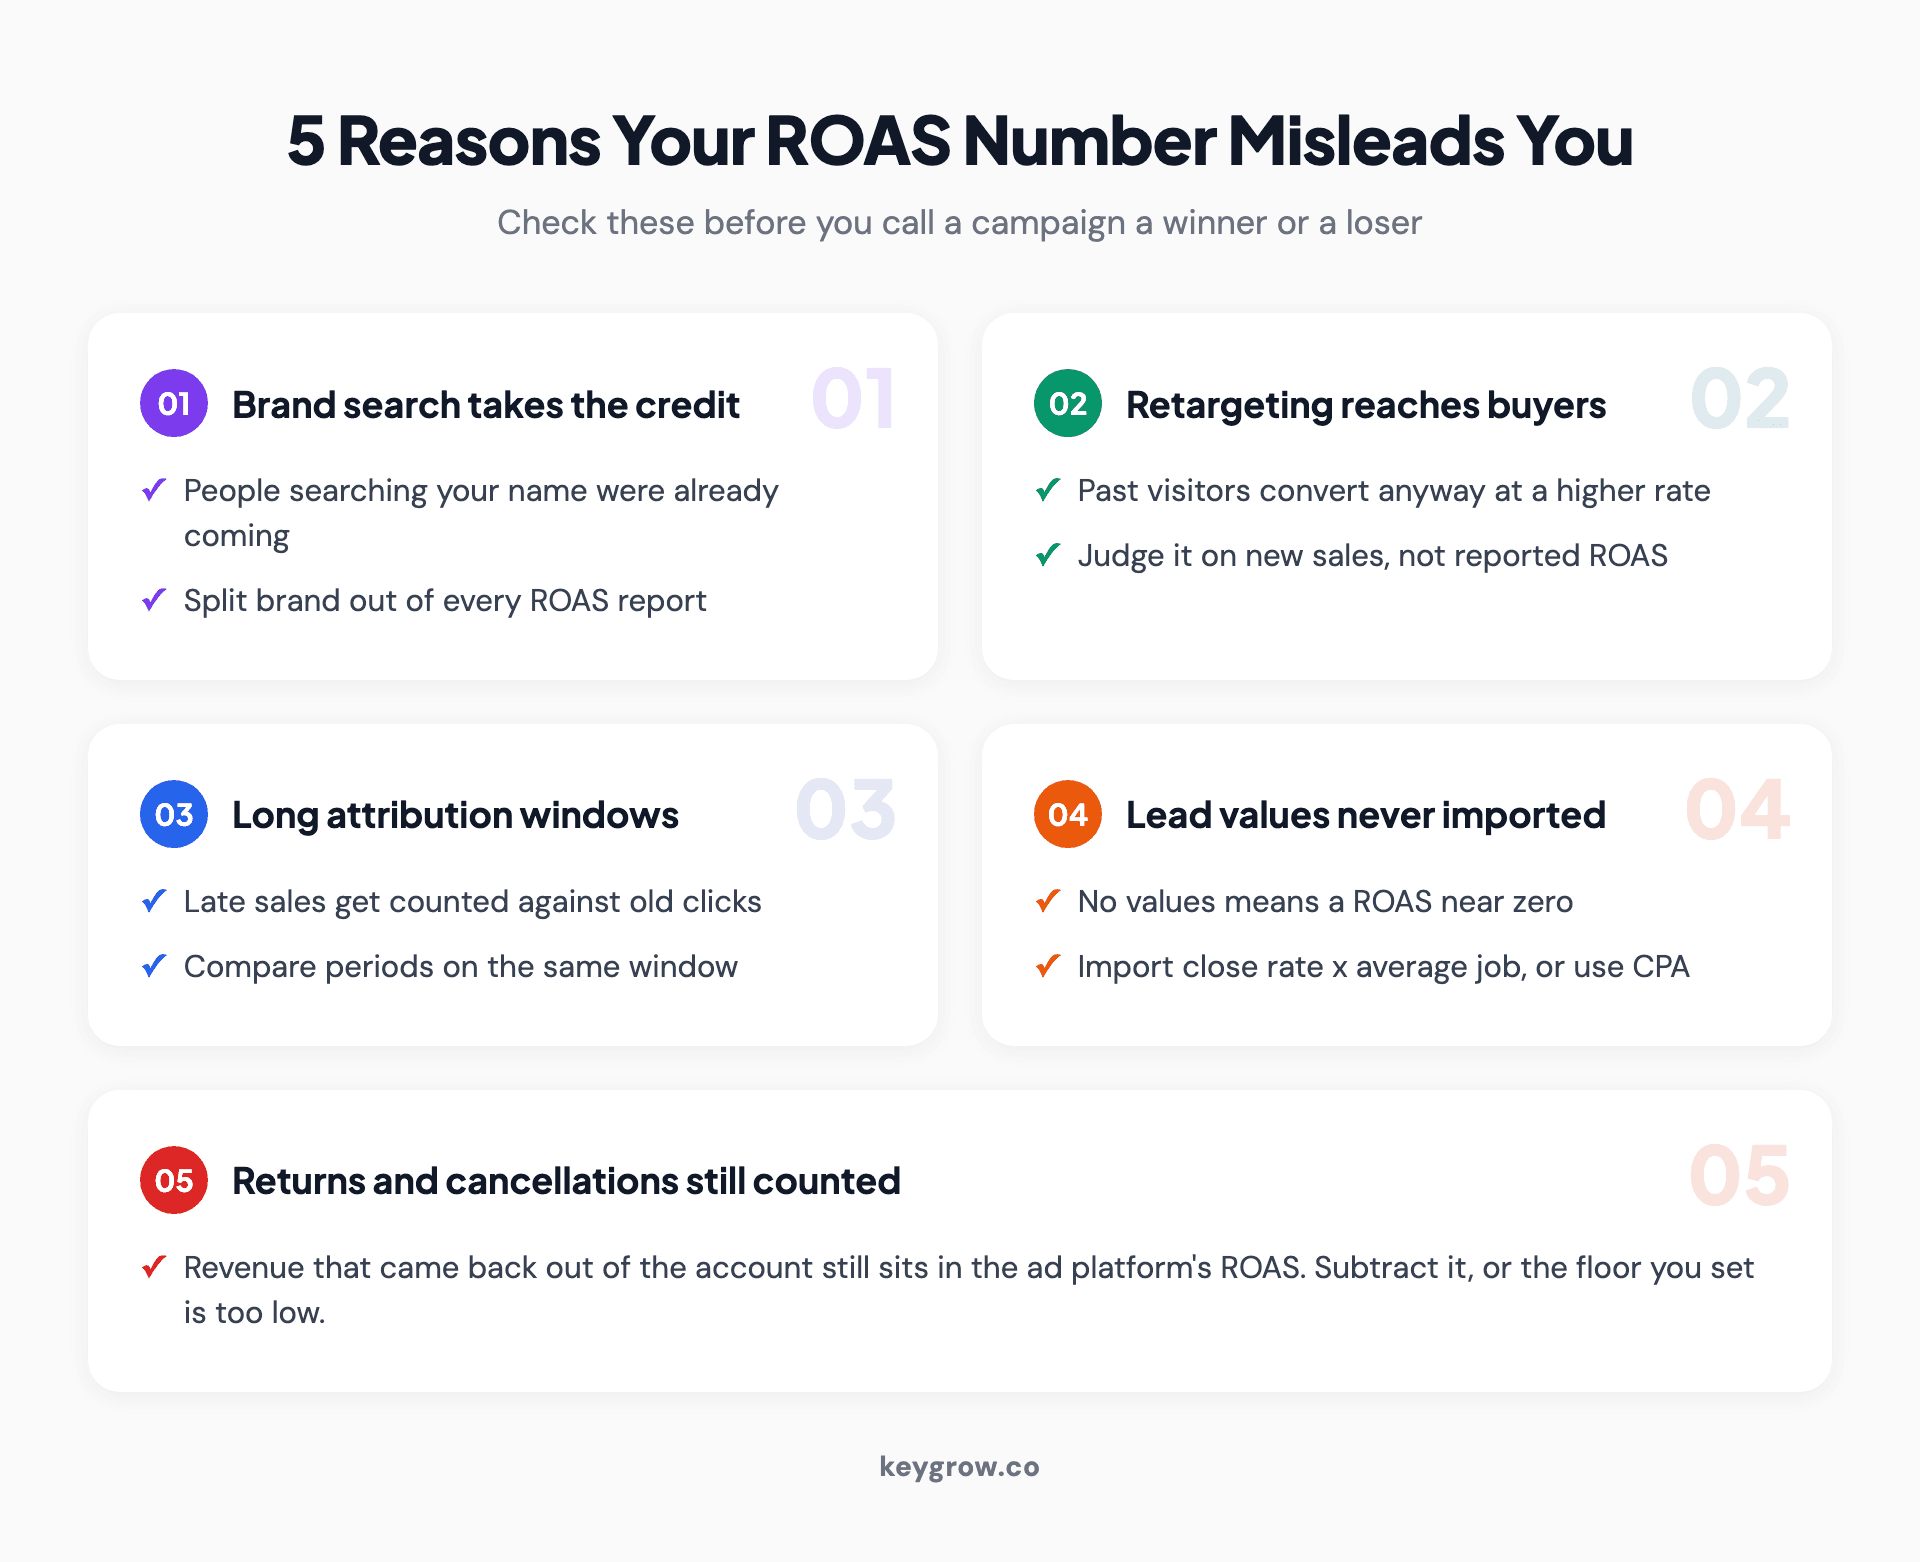
Checklist of five reasons a ROAS figure misleads: brand search claiming sales that would have happened anyway, retargeting reaching people who were already buying, long attribution windows counting late sales, lead values that were never imported, and returns and cancellations still counted as revenue.
Ad reports get this wrong constantly. Vanity metrics are the industry's worst habit, and a blended ROAS with brand search folded in is one of them. If a report opens with an account-wide ROAS, ask to see it with brand removed. If nobody can produce that view, you have learned something about the report.
Do you need an agency to set this?
Usually not, at least not to set the floor. A single store with one margin can work out break-even and a first target in twenty minutes from last quarter's numbers.
Pull your average order value and your real costs per order, check where you stand with the ROAS calculator, and set a target with the formula above. If you sell one product line and spend a few thousand a month, that is most of the strategy. Put the fee you saved into product photos or a faster checkout.
Help starts to pay when the work gets fiddly: hundreds of products across several margin bands, lead values that have to flow back from a CRM, or brand and non-brand traffic that needs separating before any number can be trusted. A store at that stage is the case for ecommerce PPC services that set targets per product group instead of one blended number. A lead-based business usually needs its conversion values built first, and that setup is part of our PPC management, which runs month to month.
FAQs
Is a 2:1 ROAS good?
Only if your contribution margin is above 50 percent. At exactly 50 percent, 2:1 is break-even. High-margin offers can clear it comfortably, while most physical products lose money at 2:1.
Is a 4:1 ROAS good?
It is break-even at a 25 percent margin and comfortably profitable at 40 percent or more. For a low-margin product, 4:1 can still be a loss. Check it against 1 divided by your own margin before you celebrate.
What is a good ROAS for Google Ads?
Optmyzr's Q2 2026 data put the median ecommerce Google Ads account at 557.17 percent, across more than 20,000 accounts. Treat that as context, not a target. A good Google Ads ROAS is whatever clears your own break-even plus fees, measured with brand search split out.
What is a good ROAS for Facebook ads?
Meta usually reports a lower ROAS than Google because it creates demand instead of catching people who are already searching. In that agency's Q1 2026 data, Meta's new-customer campaigns reported 1.83x, and incrementality testing put their real return slightly higher at 2.07x.
How do I calculate break-even ROAS?
Divide 1 by your contribution margin, which is the share of each sale left after product, shipping, payment and returns costs. A 40 percent margin gives 1 divided by 0.40, which is 2.5 or 250 percent. Use contribution margin, not net profit margin.
What is the difference between ROAS and ROI?
ROAS is revenue divided by ad spend. ROI is profit divided by total cost, including product, staff and tools. A campaign can show a strong ROAS and a negative ROI when margins are thin.
Set your floor before your target
Work out break-even, add your fees, then decide how much profit the ads should leave behind. That gives you a floor and a target, both built from your own numbers. Benchmarks come last, as a check that your trend is heading the right way.
If you would rather have someone build the conversion values and set targets per product group, tell us about your account.